Author Archives: cmstapler

Electric Vehicles

The news today is often dominated by stories of climate change and the growing need of society to divest itself of fossil fuel use. As transportation makes up almost a third of global energy expenditures, the growth of pure electric and hybrid vehicles are offering an exciting alternative to business as usual in the automotive industry.


One of the more attractive features of electric vehicles is their improvement over the inefficiencies of conventional combustion engine based vehicles.  The typical internal combustion engine (ICE) can lose up to 62% of the fuels energy just in the engine. The Tesla Model S, however, has been purported to achieve between 85% to 95% energy transfer to the wheels. A vast improvement by any measure.In part this is achieved through simplicity of purely electric system; instead of the hundreds of components found in a typical ICE based vehicle, Teslas’ typically have only have four major components:

Energy Storage System (battery)Chevy-Volt-powertrain

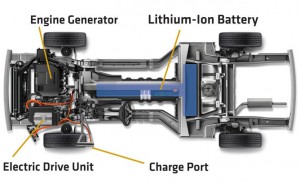
Power Electronics Module (main computer )

Electric Motor

Sequential Manual Transmission


In the Tesla Model S, electrical power drawn from the lithium ion batteries is converted into rotational force (torque) by the electric motors which then apply this torque to the transmission to rotate the wheels of the vehicle.  This is beneficial in that the Model S, by using electricity as a primary energy source,  could theoretically be driven without contributing any green house gases to the environment.  However, the lack of ubiquitous quick charging stations means that driving in excess of it’s ~200 mile battery range means that long distance travel isn’t really practical with this system yet.


The Fisker Karma, however, is unique in that it uses a ‘series-hybrid’ system.   In a series-hybrid system, an ICE only turns an electric generator instead of applying torque directly to the drive train, as a conventional vehicle does.

Hybridpeak

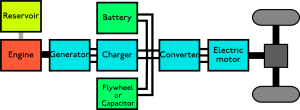
The generator provides power for driving electric traction motors, which are the only form of propulsion. The internal combustion engine is mechanically disconnected from the driving wheels. The generator, traction motors usually have an electric buffer battery between. This arrangement allows for a smaller generator engine to be used compared to the size of a conventional direct drive engine. The traction motors can receive electricity from the battery or generator or both. The traction motors, depending of the size of the battery bank, will in many cases have most of the energy provided only by the electric battery, which may be charged from external an sources such as the electricity grid. However, the on board generator can recharge the battery and power the traction motors directly on long journeys.


Both the Fisker and the Tesla are pivotal improvements over typical combustion engine powered vehicles in that they don’t rely on gasoline as the primary means to power their drive trains.  While the Tesla utilizes the primary power stored, electricity, the Fisker hybrids when using their hybrid mode, convert gasoline to electricity that is then used to power the electric motors.

While the Fisker design proves more adaptable to the various energy sources available in the United States, and is in the same approximate price region as Tesla’s fleet ($90,000-100,000), it would seem that for now, the Fisker is perhaps the best choice for those wanting to lessen their negative environmental impact while still retaining the versatility and freedom of travel that conventional vehicles offer.

These vehicles, for the benefit they provide, will undoubtedly grow in market share; as the offerings from pure ICE based vehicles are proving more poisonous and problematic with every increase of the thermometer.


http://en.wikipedia.org/wiki/Hybrid_vehicle_drivetrain#Series_hybrid

http://en.wikipedia.org/wiki/Fisker_Karma

http://auto.howstuffworks.com/tesla-roadster.htm

http://exoticcars.about.com/od/guidedtours/ss/Fisker-Karma_2.htm

http://www.consumerenergycenter.org/transportation/consumer_tips/vehicle_energy_losses.html

Electrical Generation

Coal, natural gas, and nuclear power make up the largest sources of electrical power production in the United States.  Each presents it’s own set of benefits and challenges.

In most conventional nuclear power plants, heat from radioactive decay is used to heat water, that is then used to spin turbines slaved to generators to create electricity, the steam is then cooled in a condenser (usually a large body of water such as a lake or cooling tower) and then returned back to the system to be used again.   Perhaps the most demonized of the group, nuclear energy may prove to be the most environmentally friendly to the environment in both the short and the long term.  While providingNuclear_Plant megawatts of power with virtually no green house gas emissions is a major plus, nuclear power also suffers from the dual detractors of relatively high cost of generation (11 cents/kWh) as well as the perennial issue of no long term radioactive waste disposal.

Yucca Mountain, a proposed long disposal site for nuclear waste in the US was canceled due to waste containment design flaws and poor site selection.  Without a viable plan for long term disposal as well as the recent disaster at the Fukushima Diiachi plant in Japan , wariness in public sentiment continues to hamper expansion of nuclear energy in the US.


Coal fired power plants work in a slightly different fashion wherein coal is pulverized to a fine powder and then burned in a firebox to produce rather high temperatures (up to 1000 C), this heat is used to convert water to high pressure steam that, much like in nuclear coal-plantpower, is used to spin turbines connected to electrical generators.  The water is once again cooled in a condenser and returned to the system.  The biggest, and most detrimental, difference is that the combustion of coal produces by-products. While most of what we see emanating from smoke stacks is water vapor, CO2 and SO2 (Sulfor Dioxide) create worrying challenges on the climate change front.  CO2 can make up to %15 of dry air volume emissions from these plants. While Carbon Capture and Storage, the sequestration of harmful emissions before they can be released into the atmosphere, provide some relief, CO2 from coal remains one of the most worst greenhouse gas pollutants.   That, however, is offset in this country by the vast reserves the United States possesses, making energy production from coal fairly cheap (4.5-5.5 cents/kWh).  As it supplies roughly %50 percent of the electricity in the US, without a drastic change in price or policy, this isn’t likely to change.

Natural Gas is rapidly becoming the best, worst case option for electrical generation in the US.  Not only does it produce a nominally less harmful emission than coal, it has also become cheaper as far as electrical generation is concerned (about 4 cents/kWh).  Natural gas produces energy in a fashion similar to coal, only it only requires a gas boiler to super heat the steam.  However, a recent study found that switching to natural gas, which many power plants are doing for obvious reasons, will not necessarily help the environment.  The study by Environmental Research Letters found that between now and 2055, the impact of a switch would only reduce greenhouse gases by %9, an amount to small to make significant changes.  But the switch would also delay the transition to and improvement of more environmentally friendly options such as solar, wind, and other carbon neutral sources.  Further, Methane while used in lesser quantities has a CO2 equivalence of 70 to 100.  This means that while significantly less harmful byproducts are a emitted, they can have an effect 100 times worse for the environment.

Fundamentally, all choices have drawbacks.  The task now before policy makers, and society at large, is determine which are the best among a host of bad options and then to purse them with gusto.  If our progeny are to have any semblance of decent standard of living, we have no other choice.


http://www.nirs.org/radwaste/yucca/whyyuccawouldfail2010.pdf

http://www.theguardian.com/environment/2012/mar/08/fall-nuclear-power-stations-fukushima

http://www.duke-energy.com/about-energy/generating-electricity/coal-fired-how.asp

http://peswiki.com/index.php/Directory:Cents_Per_Kilowatt-Hour

http://news.nationalgeographic.com/news/energy/2014/09/140924-natural-gas-impact-on-emissions/

Fracking


Hydraulic fracturing is a process for improving oil and gas extraction from subsurface formations that prove too tough for traditional drilling techniques.  Rocky shale formations are prime candidates for , hydrshale-gas-and-fracking-full-sized-mapaulic fracturing, or ‘fracking’.  In the US, many of these sites are located in the rural Midwest or Appalachia.

The process of fracking is unique from most other extraction methods.

Typically, water, sand, and a small amount of chemical additives are pumped deep beneath the ground (as much as 10’000 feet) under high pressure.  This forces new cracks in the subsurface strata due to the volume and pressure of the injected water; the sand is then used to wedge the new cracks open, forming easier access WhatIsFracking2paths for oil and gas to escape back up the bore hole towards the surface.

A side affect of this process is the violent disruptions of the subsurface strata.  This is a source of concern for residents that live in communities where fracking occurs.  Allegations of ground water contamination as well as other ills have dogged the methodology since it’s introduction.

However, as several Department of Energy and EPA studies have found no specific evidence to support these claims.  Activists counter that the EPA adn DOE performed studies too narrow in scope to get a full view of what’s the industry is actually doing.

With number of stories growing of children growing sick in areas where intensive fracking is occuring or contaminated groundwater sickening residents.  Many that live in these regions are hard-pressed to take either the governments studies or the industries words of care and concern at face value.

Further, some of the oil deposit estimates that helped fuel the push towards fracking are beginning to unravel, such is the case with the Monterrey Oil Shale in California, which EPA officials estimate may need to be revised downward by 96%.


At the end of the day, two things can be said: Oil exploration, even fracking,  is a very profitable business, and without clear and concise proof of it’s danger.  It will likely remain so well into the future.

Sources:


http://www2.epa.gov/hydraulicfracturing

http://energy.gov/fe/articles/netl-releases-hydraulic-fracturing-study

http://energyindependence.michamber.com/energyindependence/what-hydraulic-fracturing

http://www.latimes.com/business/la-fi-oil-20140521-story.html


Lego MindStorm

Purpose

The purpose of the Lego Mindstorm Activity was to display and test our familiarity with conversions with a real system.

Apparatus

To do this, we utilized the Lego Mindstorm, a Lego kit that once assembled, could be operated via computer to perform various functions.

Procedure

Our first task, was to assemble the robot.  This we accomplished in two person teams in our first week of lab.

Analysis

Once our robot was assembled, per the instructions provided with the syllabus, we used a USB cable to connect a desktop computer and the Lego robot.  After activating the software provided, we found that we could control the motion of the wheels connected to the robot in a few noteworthy ways.  Namely, the power applied to the wheels as well as how long the power would be applied.

Lastly, the software required the circumference of the wheels in order to perform it’s calculations.  To do this, I used a ruler to measure one wheel; a 5 cm diameter was the result.

Then, using some simple trigonometry:

circumference of a wheel = diameter of a wheel * PI

which in my case yielded:

circumference of a wheel = 5 cm * 3.141 = 15.7 cm

When provided with the Legos’ wheel circumference, as well as a time and a power setting, the software would predict how far the Lego had traveled as well as how many wheel rotations had occurred.


When I compared this predicted value with our measured values( using a ruler to actually track how far the robot actually traveled ), I could then determine the error between the predicted and measured observations. These provided the grist for the table below.

Run Time (sec) Power Wheel Rot (turns) Wheel Rot(degrees) Calc Dist (meters) Measured (meters) Error % Average Error %
1 1 75 1.28 460.8 0.1925 0.22 3.333333 2.682288661
2 1 75 1.34 482.4 0.202 0.225 2.693208
3 1 75 1.32 475.2 0.1983 0.215 2.020324
1 1.5 50 1.21 435.6 0.1812 0.21 3.680982 2.938697805
2 1.5 50 1.27 457.2 0.1908 0.21 2.39521
3 1.5 50 1.22 439.2 0.1837 0.205 2.739902
1 1.5 60 1.68 604.8 0.2525 0.28 2.58216 3.416252294
2 1.5 60 1.59 572.4 0.2322 0.275 4.219243
3 1.5 60 1.75 630 0.2613 0.3 3.447354

Analysis

By the final analysis,  for each run we found an error  that fluctuated between approximately 2.6% and 3.4%; that is, a statistically insignificant variance.

Questions

I didn’t have any truly novel questions at the end of the lab, any variances are likely the result of imprecise motors, imprecise measurements, or both.  All in all, I was happy with our results.


Energy Grid

The electrical utility industry, the primary supplier of electrical energy in the United States), is gargantuan.  Last year, it provided over 4 million Gigawatts of power through a number of intricate processes.  The sytem consists of a few major steps

Generation- The mechanism by which electricity is created; in the US the primary mechanism is via coal fired power plants.

Transmission-The means by which electricity is moved about the country, often hundreds or thousands of miles

Distribution-The means by which electrical power is apportioned to various municipalities

Delivery- The process of packaging electrical energy to individual customers.


These processes haven’t changed much in the past hundred years.  This lack of innovation results in energy losses, inefficiency in every step of the electrical generation and distribution chain.

Smart Grid is the answer to these shortcomings. Using automation, remote sensing and auto adjusting control systems.  The electrical system is slowly becoming more efficient and responsive to the nations energy.


Reference:

http://energy.gov/oe/services/technology-development/smart-grid

http://www.wikinvest.com/industry/Electric_Utilities

http://en.wikipedia.org/wiki/Electric_utility