Fruit is mostly acidic, which means it is low in pH. When two metals, copper and zinc, are added into the fruit and connected with a conductor, it will create a circuit. Batteries operate based on the same concept. Batteries consist of two metals, an anode and a cathode, which never touch and are separated by an acid. This creates a circuit when a wire is placed on both ends of the battery, and will create a chemical reaction which causes a flow of electrons to move through the circuit.
We used limes for our experiment. Limes are lower in pH than lemons or other citrus fruits, so they are ideal for a battery acid. Our hypothesis was if more limes were added to the circuit, the more voltage it would generate. We predicted this because each lime acts like a battery, and the more batteries in the circuit, the more power that is generated.
Basic illustration of a citrus circuit
Results:
Our results confirmed our hypothesis to be true. With one lime, the voltage generated was .93, with two it was 1.85 and with three it was 2.81. Essentially, with every new lime added, an extra volt was added. Unfortunately, the calculator that we were supposed to power with the limes had broken, so we couldn’t test if our lime circuit was powerful enough to light up the LCD display. Although we were disappointed that we could not see our circuit in action, we still got to see how our lime circuit was able to generate power.
Despite not being able to spend very long at the Museum due to travel issues, I was still able to get some good information on the exhibits. I found two the most interesting, the taxidermy exhibits in the green wing and the Tesla coil performance. Also, there was a seminar going on about SpaceX which mentioned the falcon rocket series, which I had blogged about in a previous post.
Other notable exhibits include the dinosaur exhibit, which had several dinosaur skeleton models, which are always interesting to look at. They had a triceratops and a T rex, which are pictured below. These are always interesting, as they give a perspective as to what animals looked like 50 million years ago. Any time that I see an animal skeleton that is the size of a sedan, I can’t help but admire the differences between these and animals today. This is back in an era where reptiles were the dominant animal, as opposed to mammals, so the animals back in the age of the dinosaurs look quite different from the ones in the Cenozoic and Pleistocene ages.
Boston MOS Triceratops Source: http://1.bp.blogspot.com/-08pEFF1Mmok/TValOiCfP9I/AAAAAAAAFbI/QglIdTtH5Mw/s1600/BMOS+20_OTIS.jpg
Taxidermy Exhibit/The Colby Room:
The taxidermy exhibit featured over a hundred species of birds from all over the continental US and some offshore feeding birds including the Gannet. Some of these birds have been brought back by conservation efforts such as the Bald Eagle, whose eggs were destroyed back in the 1960’s by DDT, a pesticide which would soften the eggshells. The Colby room featured several taxidermized rare animals including rhinoceros and pelts of animals like the Bengal Tiger.
Official picture of the Colby Room from the Boston MOS
Tesla Coil/Electricity Exhibit:
The next exhibit was the Tesla coil exhibit and the electricity exhibit. It contains two large Tesla coils which they would demonstrate a few times per day. Unfortunately, when I arrived to see one of the scheduled shows, the auditorium was full; however, I could still see the coils operate as well as seeing the coils demonstrate the Faraday cage effect. The security guard who was outside the auditorium was explaining the skin effect to the people watching from outside, and how the woman inside the cage could touch it without being electrocuted. This was due to her not being her grounded. I previously blogged about Tesla coils, and I had always wanted to see them in action. I was surprised at how loud they were and how long the bolt appeared to last after it was discharged from the spark gap. The electricity exhibit highlighted several inventions such as the previously mentioned Tesla coil and steam powered engines. It also showed a basic model of a generator which could help simplify how a generator works to someone who has no previous knowledge of them.
Official MOS picture of the tesla coil exhibit Source:http://www.mos.org/sites/dev-elvis.mos.org/files/images/main/uploads/slides/public-events_cambridge-science-festival.jpg
Chernobyl Nuclear Powerplant after its disaster in 1984 Source:http://rt.com/files/news/25/dc/00/00/cher-1.jpg
Nuclear power is a double edged sword in the eyes of most people, it is often percieved as dangerous, when in reality it is the second safest power source, behind wind power. This is something that Pandora’s Promise explains to the viewer. Several environmental activists whose views stem from the environmentalist movement in the 1960’s including Helen Caldicott, an Australian anti-nuclear advocate, continue to spread false information about nuclear power. Using Helen as an example, Pandora’s Promise explains the culture that America has produced around nuclear power, its association with nuclear weaponry and continued negative perceptions of the power source in popular culture such as The Simpsons. Pandora’s Promise offers several real world examples to counter these false cultural attitudes towards nuclear power:
-Nuclear disasters e.g. Chernobyl and Fukushima barely increase cancer rates for people living in nearby areas (according to the UN and the WHO)
-Coal power produces 3 times the radiation than nuclear power to the surrounding popluace
-Nuclear power is nearly unlimited and produces little pollution and little waste (if the reactor is a breeder reactor, not a light heat reactor which produces more waste and is inefficient)
The movie ends on a note which left me genuinely inspired, the United States is buying warheads from Russian nuclear weapons and turning them into electricity. Fifty percent of all of our nation’s nuclear power comes from these decommissioned warheads.
Overall, this movie was a refreshing break from the alarmist ecologist and environmentalist doomsday prophesiers that we have been seeing recently. The movie goes out of its way to criticize them and say that, “…to be anti-nuclear is to basically be in favor of burning fossil fuels.” It explains why thrid generation reactors are safer than the ones that have been built in the past such as Fukushima, Three Mile Island and Chernobyl. The overall message is one of hope for the future than more nations will become like France, who generates 80% of its electricity from nuclear power and provide cleaner air for future generations. If I were to rate this movie based on its message, I would give it a 4/5, it can be muddled by the explanation of older theories by 1960’s based environmentalists in the beginning, such as the Vermont and New Hampshire protesters. These are quickly argued against by the movie; however, it confused me as to what stance Pandora’s Promise was going to take on nuclear power. As a final thought, I would recommend showing this movie to anyone who is skeptical of nuclear power, as it will be hard to look at this movie and deny its benefits for large scale energy production on a long term basis.
Thermoelectric devices convert heat into electricity. They were invented in 1821 by Thomas Johann Seebeck and see consistent use to this day. To convert heat into electricity, the device takes advantage of the Seebeck Effect (V/°C), named after the devices creator.
Thermoelectric Generator:
Thermoelectric generator
A basic thermoelectric generator uses semiconductors, much like a solar cell to generate electricity. The differences between the Negative and Positive pellets create a heat transfer, and cause the generation of electricity. This is known as thermoconductivity.Thermoelectric generators can be installed at home or in a place of business, usually coming in at around 1kw of production. These power sources are off the grid and can be used in even the most remote locations.
Automotive Thermoelectric Generator:
By Gerardtv [GFDL (http://www.gnu.org/copyleft/fdl.html) or CC BY-SA 3.0 (http://creativecommons.org/licenses/by-sa/3.0)], via Wikimedia CommonsThese thermoelectric units turn heat energy generated by a car’s engine into electricity. They work by using a heat exchanger which harvests the exhaust from the engine. The hot side and cold side plates of the generator then create a difference in heat, which causes the generation of electricity through the heat transfer of the negative and positive semiconductors. The electricity generated is then used to supplement the load of the electric motor used to power devices in the car.
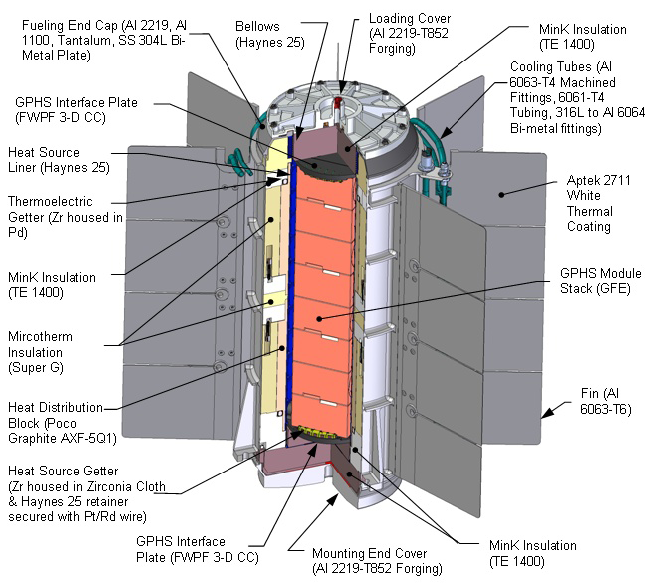
Radioscope Thermoelectric Generator
a basic radioscope thermoelectric generator (Source: NASA)
Thermoelectric devices are all very similar in that they take advantage of unused heat energy. They all use semiconductors. They are often used in a system, where unused heat energy is present. In a sense, they are more of an add-on to an existing power source rather than a power source on its own, although they can be used as such. An example of this would be the Mars rover Curiosity, which uses a radioscope thermoelectric generator (RTG). It converts heat energy from decaying plutonium into electricity. The Plutonium 238 used in most RTEs has a half life of 87.7 years. The Curiosity has a special RTG known as the Multi-Mission Radioscope thermoelectric generator (MMRTG). According to NASA, the MMRTG has 4.8kg of Plutonium (238) dioxide which provides 2,000 watts of thermal power and 110 watts of electricity. The unit itself weights 45kg.
The MMRTG (Source:By Ryan Bechtel, U.S. Department of Energy. [Public domain], via Wikimedia Commons)Other power sources are more efficient for on-site locations (such as geothermal energy) but they lack the reliability that thermoelectric devices can provide. Thermoelectric devices are solid state, meaning they have no moving parts. This means that they can be installed pretty much anywhere there is heat energy, and require little to no maintenance. The only downside to using a thermoelectric generator is their price and their potential weight, depending on the size of the generator. These two factors can be weighed out because of the potential savings and environmental benefits.
Iceland is an island nation in the northern Atlantic ocean to the southeast of Greenland. It lies near the Atlantic Ridge, leading to high amounts of Geothermal activity. This leads to a perfect setup for geothermal energy use.
Geothermal energy uses heated water underneath the earth to create steam, and spin a turbine. Once the heated water becomes cool, it is sent back underground to heat up again. Because of this, it is considered a renewable energy source. There is very little pollution involved with geothermal energy, and it has very few downsides.
Geothermal energy makes up around 66% of all renewable energy use in Iceland. In areas such as Iceland with high volcanic activity such as the western US, geothermal power can be used for more than heating homes, it can be used to power entire cities and towns. One such example is the Hellisheiði Po
Hellisheidi powerstation By ThinkGeoEnergy [CC BY 2.0 (http://creativecommons.org/licenses/by/2.0)], via Wikimedia Commonswer Station, which produces 303MW of electricity. This power station is the third largest geothermal plant in the world. Iceland has 5 other major geothermal power plants located across the country, which provide power for thousands of homes. In-home and on site geothermal generators also see use, which make little noise as well as needing little to no maintenance.
A diagram of an in-home geothermal unit (source:http://geothermalinnovation.org/geothermal-for-the-home)
These heating units can save home owners thousands of dollars a year, especially in a tundra region such as Iceland. Even homeowners in low-volcanic activity areas such as New England or the Southern US can use geothermal power to heat their homes and businesses.
Overall, I think the use of geothermal energy in Iceland is its best option. It has breathtaking landscapes, and its use of geothermal and other sustainable energy will help keep it pristine. It is one of the only countries in the world where their electricty output is nearly 100% renewable (75% from hydroelectricity and 25% from geothermal energy). This should serve as an example of the correct way to generate sustainable energy on a large scale, rather than small scattered solar and wind farms. Of course, this will not be possible in areas such as the eastern United States or sourthern Africa, where there is little volcanic activity. These regions should use their natural landscape to their advantage, wind for the eastern US and solar for southern Africa using Iceland as a blueprint. As I had discussed in my previous blog about solar technology around the world, Tampa Bay airport and George airport in South Africa have added solar technology. These little scattered projects along with large scale power plants will help nations generate clean, sustainable power, just like Iceland.
In week 4’s lab, we had two separate experiments. The first Experiment was to Calculate the average amount of light exposure to the solar panel using a flashlight at a given distance. This was done by hooking up a small solar panel to the Mindstorms unit and running it into a computer program. Once the data was collected, we would then export the data used in the program to Excel. On Excel, we calculated the average exposure of light to the panel.
The results were satisfying, the further away the light source, the less average exposure the panel received. For our control of 0cm away, the panel put out an average of 0.389 units. For the 2cm, the panel put out an average of 0.37, units of light. This trend continued for 4cm away and 6cm away and finally stayed consistent for our final measurement of 20cm away, 0.196. This showed that the further we moved the light source away, the output of the solar panel decreased by a steady amount, around .10 to .20.
The second half of the experiment measured output based on wavelengths rather than distance. We placed the light source at 10cm, and for each trial, we swapped out a small colored strip of plastic on top of the solar panel for a different color. The rest of the experiment is identical, we used the same procedure and Mindstorms equipment from before. When we plugged in the data, it corresponded along with the Red, Orange Yellow, Green, Blue, Indigo and Violet color spectrum. The lower frequency strips, yellow and red yielded an output of 0.214 and 0.188 respectively. The higher frequency strips, green and blue yielded outputs of 0.165 and 0.134. This showed that the higher wavelengths that were being absorbed, the less energy was able to get to the solar cell.
The visible light spectrum, from highest frequency (violet) to lowest (red)
Overall, the data in this experiment was consistent and had little to no error. The only thing that I wish that we could have tested is the full color spectrum rather than just 4 colors.
Solar energy is taking off around the world. In Taiwan, solar energy is part of a push to make renewable resources 12.6 percent of the nation’s energy output by 2030. This does not have to mean solar energy, but it will play a large role in achieving this goal. According to Eco-Business.com, Taiwan will demand 100,000 jobs and have a production value of $29.7 billion USD by 2020. As an International Economics major, I support this push by the government to achieve this goal. It will create high tech jobs and bring in revenue for Taiwan as well as reducing oil imports. From an environmental standpoint, I think that this is a realistic goal for Taiwan and it could provide a standard for other countries to work towards.
The next country is the United States, which is taking a more passive approach to solar energy in most cases. According to the Tampa Tribune, Tampa Airport is installing solar panels on one of its parking garage which will produce 2 MW and provide power to around 250 local homes. This canopy is the future of energy production, instead of massive solar farms, small scale projects such as this will provide power locally. Solar farms are more space inefficient compared to rooftop installations. The benefits from this project are obvious, from simply putting down solar panels, people on the top floor of the garage will have nice shade from the Tampa sun as well as generating a respectable 2 MW of power while being unobtrusive to the scenery.
The final country is South Africa, which is building the continent’s first solar powered airport. This is a larger project which will take up 200 square meters and produce a massive 750 MW. This is more than enough power to power the airport and the surplus will be sold off to local energy companies. According to the South Africa’s Minister of Transport, Diupo Peters, the plant will provide an extra 3725 MW to local energy production. South African President Zuma has stated that the growing drive for renewable resources has created over 109,000 jobs as well as provided over $12 billion USD to its economy.
All three of these projects will provide clean energy for their countries as well as demonstrating the three sizes of projects, small scale, large scale and nationwide efforts. I agree with and support more of these projects around the world as they generate energy and revenue for their people as well as cutting down on air pollution. A place where I would like to see more development with solar technology is China, where their air pollution from burning fossil fuels is so bad people have to wear gas masks in some regions of the country. As a final thought, these projects should continue to serve as examples for other countries to follow, rather than isolated projects in order for more progress to be made in this field.
Shake lab Data
The goal of this experiment was to graph the data from a shake generator to find a correlation between the number of shakes and power generated. After we shook the generator for 30 seconds, we plugged the data into a program which gave us a series of numbers. We then averaged out the numbers and added them together. This gave us a total which represented the points on our graph.
An outlier (the thrid point from the right) skewed our data which showed an inconstancy in that the ratio of power generated is negative compared to the number of shakes. The opposite is true. The trend line was supposed to be pointing upward instead of downward. This could have been caused by a miscount of the number of shakes on point 5 (the third point from the right) and point 6 (the sixth point from the right). The differential between the two is only by 1, 100 compared to 101. Overall, this experiment could have gone better but serves as an example of the need for accurate data.
A shake generator similar to the one used in the experiment Source: http://www.dansdata.com/ledlights11.htm
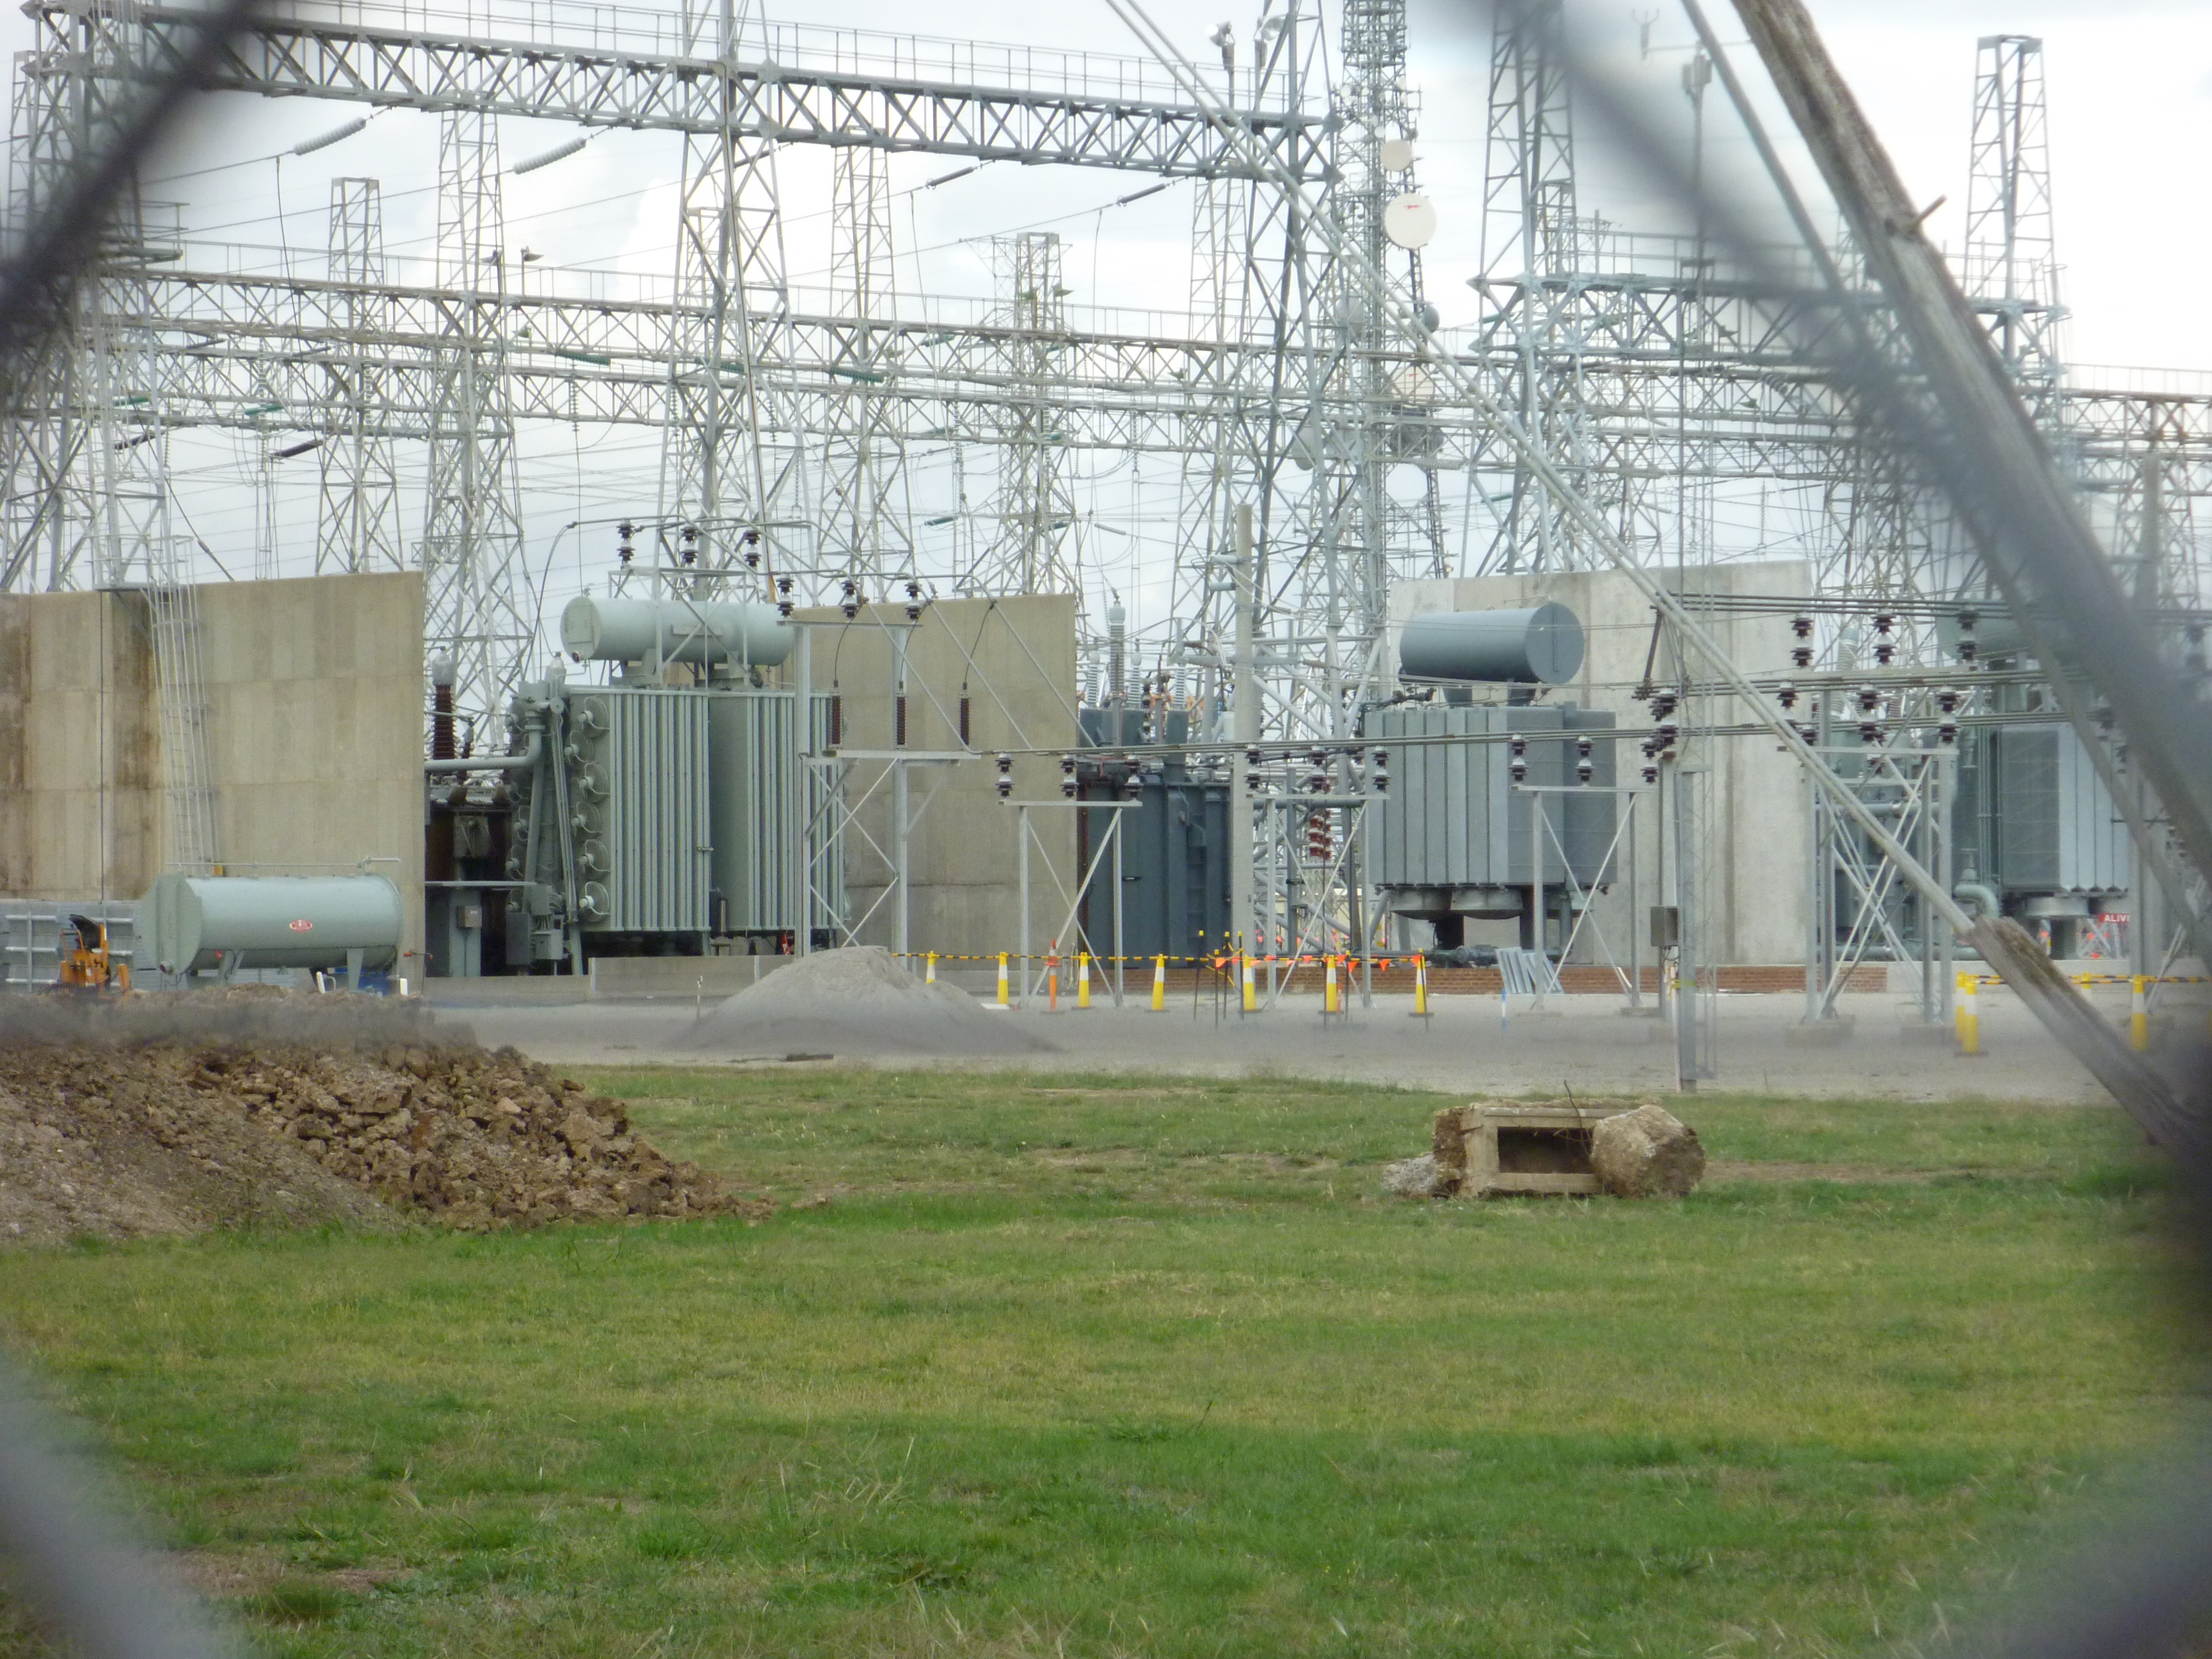
Nikola Tesla was a scientist who lived from 1856 to 1947. He worked with AC power, rather than the DC power which Edison used at the time. The two would become bitter rivals, Edison had the edge in business; however, Tesla would eventually win out due to the almost perfectly superior AC power. AC power is safer and can travel over long distances without the need for substations.
A power substation
Tesla’s work could best be described in his wireless energy emitting Tesla Coil. The Tesla Coil was the first method of wireless energy transmission. When activated, electricity moves around the coil and builds up. When the electricity is built up in the secondary coil to the point where it can no longer store any more, it is released in an lighting bolt-like electrical burst, pictured below.
A Tesla Coil in actionThe Tesla Coil is amazing to look at, even though it doesn’t have a practical application anymore. It is a great demonstration of electrical projection and is easy to understand.
A WPT (wireless power transfer) system is the modern day version of Tesla’s work with wireless energy. In most WPTs, two copper coils (akin to a Tesla Coil) send electricity between each other. This wireless transmission of electricity is known as resonant inductive coupling. At IMTO University, researchers are developing a high efficiency WPT which uses two spherical dielectric resonators.
A problem that most WPT’s have is power loss during the electricity transfer. The new system aims to remedy this problem using a a frequency known as magnetic quadrupole mode. This is more efficient than the standard dipole mode that most WPT’s use.
Despite being over 100 years old, Tesla’s work is still being refined and implemented to this day. In the future, these WPT technologies could replace wires or even electrical lines. It will be interesting to see in 100 more years (2116 as of the time this is published) if wires are used less or completely eliminated from everyday use, which could very well happen if developments in this field continue.
Sources:
http://www.biography.com/people/nikola-tesla-9504443
http://www.livescience.com/46745-how-tesla-coil-works.html
Tesla Coil picture: fir0002 | flagstaffotos.com.au [GFDL 1.2 (http://www.gnu.org/licenses/old-licenses/fdl-1.2.html)], via Wikimedia Commons
http://www.eurekalert.org/pub_releases/2016-02/iu-rph020316.php
This experiment involved measuring the amount of kinetic energy needed to move a weight using a pulley and a motor. For each trial, we used 5 attempts. For every attempt, we changed the weight that was used but kept the force constant. We would then measure the time needed for the weight to reach the apex of the pulley.
The data (namely the trend line) clearly shows a positive correlation between increasing mass and the time it took for the weight to travel up the rope under the same force. We could make a general rule stating that as the weight increased, the resistance increased against the pulley, barring human error in stopping the pulley prematurely or late, which definitely affected the results. Also, there is a negative correlation between power and time: when power is decreased, the time it takes for the weight to reach the top increases. If one factor could be eliminated in this experiment to reduce error, it would be an automated stop when the weight reaches the apex of the pulley. When the operator stops the motor, it is always in a different spot, which skewed the numbers. Nevertheless, the line trends stayed true to the experiment even with the outliers taken into consideration. in this experiment. Overall, this experiment is a great display of kinetic energy and the relationship between effort and resistance.


![fir0002 | flagstaffotos.com.au [GFDL 1.2 (http://www.gnu.org/licenses/old-licenses/fdl-1.2.html)], via Wikimedia Commons](https://upload.wikimedia.org/wikipedia/commons/f/fa/Lightning_simulator_questacon02.jpg)
