Monthly Archives: February 2014

Iceland’s Geothermal Energy

Iceland: Geothermal Phenomenon

Because of its singular geological position, Iceland has the special conditions needed to generate geothermal energy. The high degree of volcanism, along with the world renowned expertise of Icelandic specialists in the field of geothermal energy utilization, enables Iceland to be the world leader the production of this eco-friendly, sustainable and renewable power.” 

icegeo

As you probably figured out from the quote above, Iceland is one of the world leaders in geothermal energy. It currently uses Geothermal to provide about 65% of its energy. Geothermal energy in Iceland is used in several ways such as being harnessed for heat and also producing electricity. Icelanders use geothermal energy for just about any purpose. The following video goes in depth about how Iceland uses geothermal energy.

They do not need to burn coal to produce energy, they just use the steam directly from the earth.

20120104-01a


geopower3

Their location is a geothermal hotspot. You have probably seen pictures of hot springs, geysers or steam coming out of the ground. That was most likely Iceland. Due to potential and many possibilities, geothermal power will continue to be the main source of growth of the energy industry in Iceland. Because Iceland has a large supply of geothermal energy, it has a low cost, which is why Iceland has” the lowest cost of electricity than most other OECD countries. (“http://askjaenergy.org/iceland-introduction/iceland-energy-sector/.) Besides geothermal energy being a very low cost in Iceland, it is also much cleaner. There is no smoke or gases being burned during this process. No pollutants get discharged into the air which can reduce harmful emissions.

As you can see if the graph below geothermal energy ir the primary energy source and provides almost 25% of the nations electricity.

Iceland-Renewable-Energy-2011

Overall Iceland continues to dominate the geothermal industry. Their prime location makes it possible to grow unconditionally. Question is, will they use all the geothermal for themselves? or will they export it to other nations in need of environmental changes?

http://www.nea.is/media/utgafa/energy_statistics_2009_vefur.pdf

http://www.nea.is/geothermal/

http://en.wikipedia.org/wiki/Geothermal_power_in_Iceland

http://environment.nationalgeographic.com/environment/global-warming/geothermal-profile/

Sterling heat engine and Peltier Device,

Stirling Heat Engine.

Page 9

The Stirling Heat Engine was invented by Robert Stirling in 1816. Today the Stirling Engine has a lot of potential but is only used in special applications. What makes the Stirling engines unique is that they do not use internal combustion like many other engines. They use what is called the Stirling Cycle. Stirling engines do not produce exhaust because all of their gases never leave the engine. Because of this Stirling engines are very quiet and environmentally friendly. Stirling engines use external heat sources and no combustion takes place within the engine. Because they can use almost anything as fuel they are “one of the cleanest engines in the world’. http://www.kockums.se/en/products-services/submarines/stirling-aip-system/the-stirling-engine/.

Take a look at this video to see exactly how a Stirling Engine works.:

Stirling Engines Today: StirlingAIP_blueline

Stirling Engines are still used today in certain areas, however many people are not aware of these applications. Stirling engines are particularly used in the military for sources of electricity for submarines and other surface vessels. Sweden and Australia are currently taking advantage of this. Besides military, Stirling Engines are also used domestically. Some examples included cordless hairdryers, providing basic power, and also as cat magnets. Due to the clean source of energy that it produces, Stirling engines will continue to be used for a variety of things in our future.


Peltier Device: ( Peltier Effect ) ( Thermoelectric Energy )2


The Peltier Effect is named after the French physicist Jean Charles Athanase Peltier who founded it in 1834. Peltier devices are usually very small, however they are a solid state and considered extremely durable. Peltier devices are usually made by semiconductors. They are used to convert thermal energy into electrical energy. They can be used for heating and cooling, not only air but liquid as well, but are primarily used for cooling. When DC current passes through the device it brings heat from one side to the other so in turn one side gets cooler and the other gets hotter.

Thermoelectric Energy Today

thermoelectric

Thermoelectric energy is very useful in the transportation sector which is currently the largest consumer of fossil fuels and the largest polluter of the environment which we have learned about the past several weeks. Heat energy from exhaust pipes of motor vehicles can be transformed to electric use by Peltier devices. These kinds of opportunities will be taken advantage of and progress rapidly.

Overall as the future nears, devices like Stirling engines and Peltier devices will become more common. They are more efficient and will become cheaper as time goes on.


http://www.heatsink-guide.com/peltier

http://www.purdue.edu/discoverypark/energy/research/transportation/thermoelectric.php

http://auto.howstuffworks.com/stirling-engine.htm

Solar Cell Activity

SOLAR CELL LAB:

lab-solar-cell

Last week in class we were assigned a solar activity lab. For the experiment we used a solar cell, voltage probe, a flashlight and some different colored filters. After we hooked everything up to solar view we were ready to go.  Our main objective was to measure the relationship between light intensity and voltage. There were two parts of the experiment. First we measured the voltage and lighting without any filter. The second part of the experiment we did use filters to measure the relationship. This of course gave us a difference in the voltage generated. After we got the data we used excel to calculate the average and also to draw us the graph. The results were as follows, the more the distance between the light and solar panel increased, the more the voltage decreased.

Solar-1-

The next part is when we used the color filters. The relationship was quite different because there was no barrier in between that prevented the light waves from coming through. We used a red,green and blue filter. Red was the darkest and let the least amount of light through. Our green one was the lightest color therefore produced the most voltage out of the three. 

Solar-2-


Over it was a great exercise to experience the affects of light and voltage first hand. This is something that is very useful in the solar energy field. Which will be continuing to develop further in the future.


Generator Experiment

Last week during class we did an interesting generator experiment. Our assignment was to measure the voltage produced shaking an old flashlight. We hooked up the equipment to lab view and became working. Fortunately this week there were no complications with the program. When the generator was shaken weakly it produced very little voltage. When shaken vigorously the voltage produced was much higher.  Our data shows that the voltage increases the higher the number of shakes. This experiment was an example of Faradays Law  which states that “any change in the magnetic environment of a coil of wire will cause a voltage to be induced in a coil”. Whether the movement was small or large there was always something produced. The magnet that was in the generator was what produced the voltage. When I was shaking it I could easily feel it clicking back and forth throughout the flashlight. This force of producing energy is just a minor example of how we can use energy such as wind or water on much larger levels.

photo-13


Our Data.

1st run            2nd run           3rd run

85 shakes      145 shakes   245 shakes
0.0238               0.06229        0.06229
-5.51876         -0.16865               0.0238
0.21625           6.46446                 0.04946
0.03663          -0.02752               -0.04035
0.38304          -0.06601                -0.02752
-0.00186          0.12644               0.03663
-5.53159          -0.00186              -0.04035
-5.53159         0.03663                0.01097
0.11361            0.08795                -0.89996
0.03663            0.07512                -0.16865
6.51578            1.14001                 -0.01469
0.17776           -3.72256                0.03663
-0.00186          6.37465                0.07512
0.57549             1.0502                   1.67887
-0.01469            6.52861              -0.04035
0.06229            0.30606                6.47729
-5.54442           -0.02752              -5.57008
-0.2328             0.17776                 -0.02752
-0.01469            6.38748                0.19059
0.04946            -0.04035               -0.1045
0.03663           0.52417                -0.01469
-0.02752           6.54144               0.06229
0.07512           6.57993                 0.10078
-0.02752          0.67813               -0.00186
-0.01469           0.04946                0.22908
0.0238             0.06229                  -0.04035
0.04946            0.03663                 0.01097
0.06229            -0.02752                0.49851

Solar Energy Efforts Around the World

What is Solar Energy?

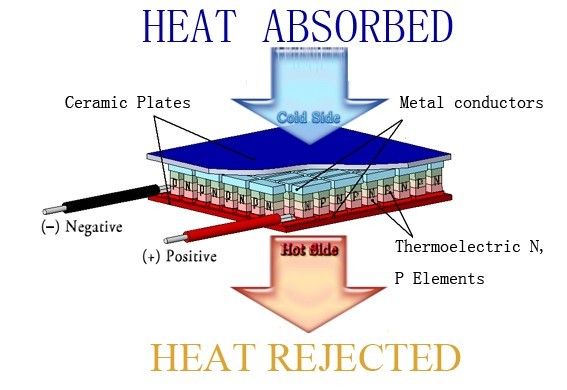
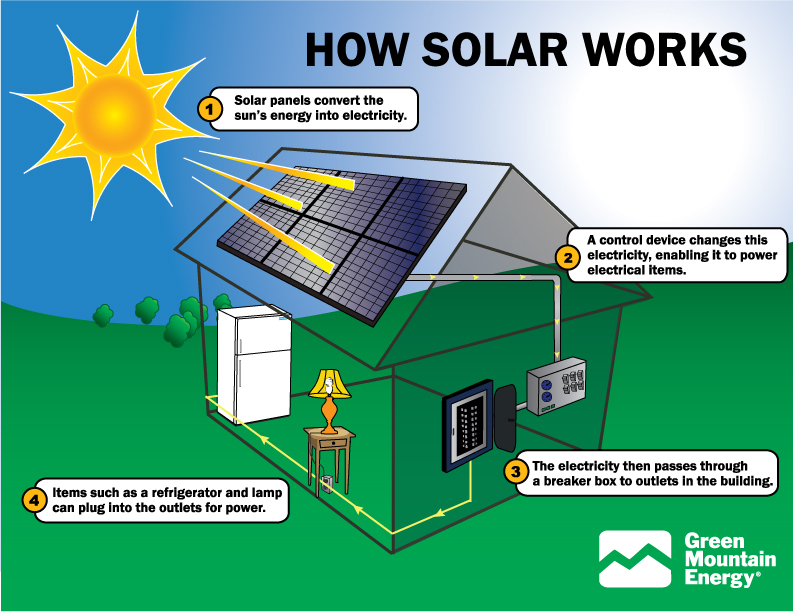
Over the past decade or so you have probably noticed those black panels that are increasingly popping up,  such as on top of houses, or mounted on a the post of a street light. These are called solar panels, and are used to convert the suns rays into useable energy. The scientific term for solar panel is photovoltaic cells. Photovoltaic cells are made from semiconductor material ( computer chips ). When the sunlight hits the solar panels it knocks the electrons loose from its atoms and as these electrons move through the cell it produces electricity. Solar energy is debateably the cleanest and most abundant energy source In the world. Solar energy is available free of cost in every part of world, however it requires large investments and massive land areas to establish the conditions to convert the solar energy into useable energy forms. Solar energy is continuing to grow throughout the world.

Innovative Solar Projects.

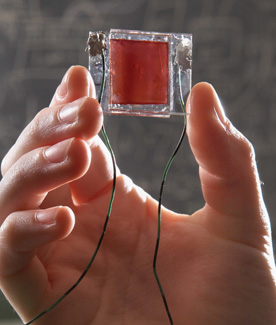
Recently, due to new innovative Solar Products.  Harvesting solar energy doesn’t have to mean using giant panels and requiring large land masses. Because of innovations in solar film technology. These solar films can be ‘printed’ in rolls, which greatly reduces both the cost and the installation, as well as opening up new opportunities for countries and companies to utilize this new technology.

solar-panels-working-scheme

Solar Around the Globe:

Coutnries with the most installed solar energy in MW MW
Germany 9,785
Spain 3,386
Japan 2,633
United States 1,650
Italy 1,167
Czech Republic 465
Belgium 363
China 305
France 272
India 120

http://www.statisticbrain.com/solar-energy-statistics/

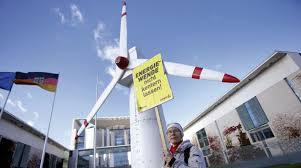
Germany is currently the worlds leader in solar energy and is continuing to progress.

Unknown

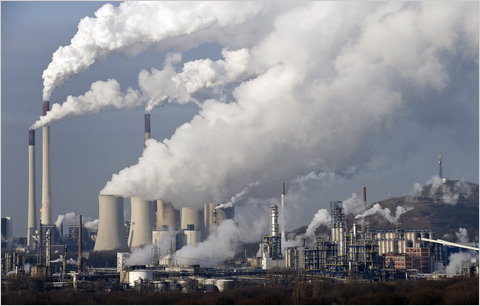
How did a once coal dependent nation become the worlds most efficient solar energy producer?

In 1991 the EEG or ” renewable energy law” was passesd .”The EEG required utility companies to plug all renewable power producers, down to the smallest rooftop solar panel, into the national grid and buy their power at a fixed, slightly above-market rate that guaranteed a modest return over the long term”. http://www.motherjones.com/environment/2013/04/germany-solar-power-energy. Once investors heard about this opportunity they viewed it as a long term investment. Not long after, billions were invested and solar energy began to thrive in the nation. This is not only common in Germany, but in many other countries around the world as well. If there is money to be made, then it will be invested in. Which is why many countries are promoting solar energy growth.

Below is a table of Germanys solar progression.

Year                                                Capacity (MW) Annual yield (GWh)   % of consumption
2000 114 60 0.01
2001 176 76 0.01
2002 296 162 0.03
2003 435 313 0.05
2004 1,105 557 0.09
2005 2,056 1,282 0.2
2006 2,899 2,220 0.4
2007 4,170 3,075 0.5
2008 6,120 4,420 0.7
2009 10,566 6,583 1.1
2010 17,554 11,729 1.9
2011 25,039 19,599 3.2
2012 32,643 26,380 4.4

Every year Germany seems to be improving rapidly in solar energy. Recently “A new German energy storage system has received a 2013  German Renewables Award at a ceremony which was held earlier this month in. The innovative system is called the ASD Sonnenspeicher. It was created by  Automatic Storage Device (ASD).”

ASD-Sonnenspeicher
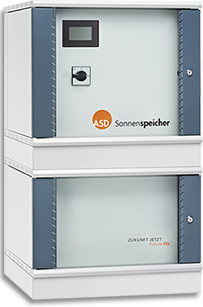
If you would like to learn more about this device you can read more at http://cleantechnica.com/2013/11/26/solar-energy-storage-system-wins-2013-german-renewables-award/#BH8furyrvR2G4M5l.99

or watch the video: http://www.youtube.com/watch?v=j691xmqSe38

India:

Unknown

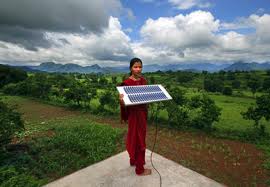
As you can see in the first table above, India is not performing as well as it would like to when it comes to solar energy. However, this will change over time due to the increase of solar energy in rural areas. Renewable Energy  is now making an impact in rural areas like this. The Indian RE program was amongst the first few  programmes to shape up globally. Since then, it has assumed  market leadership position in areas such as solar energy. Products like solar panels are now widely being used in India and other parts of the world.  “India’s national solar program was launched in January 2010 and aims to bring 20,000 megawatts of solar power to India by 2022. The program has driven dramatic growth-India has grown its solar capacity from nearly nothing to more than 2,000 megawatts. ”  http://www.huffingtonpost.com/ilana-solomon/us-challenges-indias-sola_b_4789919.html

Overall solar energy will continue to increase as we evolve as a planet. Its benefits greatly outweigh the burdens. If we want to change the way we are affecting our planet than this is a great opportunity.

http://environment.nationalgeographic.com/environment/global-warming/solar-power-profile/ 

Lego Pulley Experiment. Feb 7, 2014

In class on Febuary 7th we were assigned another experiment. Our objective  was to determine the relationship between acceleration and mass. We had to pick a mass and a force and record the DATA. Also we were to keep the power fixed but change the mass. To do this we had to enter various codes into lab view. There were some complications at first because the program was not working properly but my partner and I still obtained some results.

Results:

Power: 85 Newtons     Mass: 0.04kg       Acceleration: 2125        Potential Energy: 0.0592: 

Power: 85 Newtons     Mass: 0.06kg       Acceleration: 1416         Potential Energy: 0.118

Power: 85 Newtons     Mass: 0.08kg       Acceleration: 1063        Potential Energy: 0.176

Electricity Generation from coal-fired, natural gas, and nuclear power plants.

Electricity can be generated in many ways. During this blog I will focus on three methods. They include coal fired power plants, natural gas power plants and nuclear power plants. Although they all produce electricity, each one has its own unique process.

Coal fired power plants:Coal-schematic-3D

The first step in producing electricity from coal requires the coal to be broken up into powder. This makes the coal more easy to burn and use as fuel. After it is made into powder it is blown into the boiler where it is then converted from chemical energy into heat energy. Eventually the steam from the coal heats up a turbine which turns the heat energy into mechanical energy. After that it is turned into electrical energy by a transformer in which the national grid uses to connect to people and businesses all over. Coal fired plants are one of the easier methods of producing energy, however they have some harmful effects on the environment.


piecoalx-large

http://www.worldcoal.org/coal/uses-of-coal/coal-electricity/

https://www.edfenergy.com/energyfuture/coal-generation

Natural gas power plants.

Natural gas is a fossil fuel that forms underground over thousands of years. Each country has a limited supply. According to the U.S Department of Energy, Energy Information Administration, Annual Energy Outlook 2005. “In 2003, natural gas reserves in the United States were estimated to be 1,338 trillion cubic feet, and U.S. gas production was 18.6 trillion cubic feet”. The natural gas can be combusted to form electricity. The natural gas power production process begins with the extraction of natural gas from the ground, then it is transferred to the power plants in which boilers convert it to generate electricity. Burning natural gas to produce power does harm the air quality, however its impact is less sever than burning coal or oil. Burning natural gas produces high numbers of methane and nitrogen oxides. According to U.S. EPA, eGRID 2000, “The average emissions rates in the United States from natural gas-fired generation are: 1135 lbs/MWh of carbon dioxide, 0.1 lbs/MWh of sulfur dioxide, and 1.7 lbs/MWh of nitrogen oxides”.

A basic setup of a natural gas power plant.

NGCC_diagram

http://www.epa.gov/cleanenergy/energy-and-you/affect/natural-gas.html#footnotes


Nuclear Power Plants

A third method of generating electricity included nuclear power plants. Nuclear power plants are similar to other electrical generating facilities. However the method of obtaining that energy can be a title bit more complex. A nuclear reactor produces energy by splitting uranium atoms. This process is called fission. When the uranium particles split they absorb subatomic particles called neutrons. This process releases energy. This reaction heats water which in turn produces steam to activate the generators to produce electricity.

http://www.cpsenergy.com/Services/Generate_Deliver_Energy/Nuclear/nuke_generation.asp

http://www.world-nuclear.org/Nuclear-Basics/How-does-a-nuclear-reactor-make-electricity-/

Lego Robotics Blog #2

During last class we continued to work with out robots and Labview, however out assigned task were different. We were asked to measure the distance and speed of our robots with a ruler and then calculate the percent error. This was a fun hands on activity that I really enjoyed. The percent error was different every time according to the power we set in lab view and the distance the robot traveled.

The results for each trial

Trial 1

Power: 75

Robot distance: 0.27987m

Ruler distance: 0.22m

Average: 2.579

Percent error: 1.54%


Trial 2

Power: 100

Robot distance: 0.41012m

Ruler distance: .35m

Average: 0.385

Percent error: 16.1%


Trial 3

Power: 35

Robot distance: 0.17444m

Ruler distance: 0.11m

Average: 0.12005

Percent error: 16.2%


Germanys Green Energy Policy

There has been much news over Germanys Green Energy Policy over the past several years about how it is going to change its entire energy infrastructure to promote renewable energy sources? However it has not turned out quite like that. Over the past year Germany has mined significant amounts of coal in which consumption jumped 8 percent in the first half of 2013. Last year Germans produced more CO2 emissions than they have in previous years. This was not how the green energy policy was suppose to work.

coal-blogSpan


Germany Green Energy Policy sounds great but of course it has its downfalls. For society as a whole, the costs have reached levels comparable only to the euro-zone bailouts. This year,” German consumers will be forced to pay 26 billions dollars for electricity from solar, wind and biogas plants, electricity has a market price of just over 3 euros . Electricity is becoming so expensive in Germany that many citizens can’t afford it anymore. Whats even worse, after spending billions of Euros on subsidies, Germany’s total combined solar facilities have contributed only 0.084% of Germany’s electricity over the last 22 years. “.http://www.spiegel.de/international/germany/high-costs-and-errors-of-german-transition-to-renewable-energy-a-920288.html

Unknown

Why is it failing?

Renewable energy such as solar panel and wind turbines have the ability to generate massive amounts of electricity. But what happens at night when there is no sun, or when there is no wind? Because of this the country might either have a surplus of energy or a deficit. “Generating energy with wind involves extreme fluctuations because it depends on the weather and includes periods without any recognizable capacity for days, or suddenly occurring supply peaks that push the grid to its limits,” a 2012 report from Germany energy expert Dr. Guenter Keil notes. When there is a shortage of energy the coal plants are fired up on overdrive producing more emissions than they were to begin with.

http://www.forbes.com/sites/realspin/2013/03/14/germanys-green-energy-disaster-a-cautionary-tale-for-world-leaders/

http://wattsupwiththat.com/2012/08/28/germanys-new-renewable-energy-policy/

http://www.spiegel.de/international/germany/high-costs-and-errors-of-german-transition-to-renewable-energy-a-920288.html