Two Nuclear Disasters

1. Chernobyl, Ukraine 1986

chernobyl-300x249

The Chernobyl Nuclear disaster is widely considered to have been the worst power plant accident in history, and is one of only two classified as a level 7 event on the International Nuclear Event Scale. The battle to contain the contamination and avert a greater catastrophe ultimately involved over 500,000 workers and cost an estimated 18 billion rubles. The official Soviet casualty count of 31 deaths has been disputed and long-term effects such as cancers and deformities are still being accounted for.

How it occur??

On April 26th, 1986, at 1:23 am, Alexander Akimov did what he and thousands of other nuclear plant operators have been trained to do. When confronted with confusing reactor indications, he initiated an emergency shutdown of Unit 4 of the large electricity generating station near Pripyat in Ukraine.

The operating crew was planning to test whether the turbines could produce sufficient energy to keep the coolant pumps running in the event of a loss of power until the emergency diesel generator was activated.

To prevent any interruptions to the power of the reactor, the safety systems were deliberately switched off. To conduct the test, the reactor had to be powered down to 25 percent of its capacity. This procedure did not go according to plan and the reactor power level fell to less than 1 percent. The power therefore had to be slowly increased. But 30 seconds after the start of the test, there was an unexpected power surge. The reactor’s emergency shutdown failed.

The reactor’s fuel elements ruptured and there was a violent explosion. The 1000-tonne sealing cap on the reactor building was blown off. At temperatures of over 2000°C, the fuel rods melted. The graphite covering of the reactor then ignited. The graphite burned for nine days, churning huge quantities of radiation into the environment.

2. Fukushima, Japan 2011

9a2f920fff9f658a115b97abcc023997-300x224

The Fukushima Daiichi nuclear disaster was a series of equipment failures, nuclear meltdowns and releases of radioactive materials at the Fukushima, Nuclear Power Plant, following the Tohoku Tsunami on 11 March, 2011. It is the largest nuclear disaster since the Chernobyl disaster of 1986 and only the second disaster to measure Level 7 on the INES.

HOW it occur?

The Fukushima Daiichi nuclear power station located in the Pacific Ocean coast received huge damage by the earthquake and tsunami. The piping facility in the building, the facilities for the external power supply and backup power were destroyed. The next day, 12th in the early morning, the leakage of radioactive materials had been found in front of the main gate of the nuclear power plant. The steam was filled in the building by the core melt down caused by the dysfunction of the cooling system.


HOW can make nuclear technology safer.

1.high-quality design & construction,

2.equipment which prevents operational disturbances or human failures and errors developing into problems,
3.comprehensive monitoring and regular testing to detect equipment or operator failures,
4.redundant and diverse systems to control damage to the fuel and prevent significant radioactive releases,
5.provision to confine the effects of severe fuel damage (or any other problem) to the plant itself.


References

Top 10 Nuclear Disasters

http://www.world-nuclear.org/information-library/safety-and-security/safety-of-plants/safety-of-nuclear-power-reactors.aspx

http://fukushimaontheglobe.com/the-earthquake-and-the-nuclear-accident/whats-happened

MoS exhibits


We had a trip on the museum on Friday.

Our professor assign us to view the three MOS exhibits.

I hold the map and found the MOS exhibits position.image1

I found first exhibits :

Catching the wind

Wind power is a natural and clean resource generated by wind turbines to perform tasks or convert wind into usable electricity. Wind is a form solar energy.And wind power is measured  in units called kilowatts(kW).

Turing wind into electricity

Wind turbines catch the energy of the wind and change it into a form we can use.As the wind turns a turbine’s blades, the machinery inside the nacelle converts the energy into electricity.

There have five type of wind turbines on the museum roof catch the energy of the wind and convert it into electricity.

  1. Proven 6
  2. Skystream
  3. Avx1000
  4. Swift
  5. windspire


I continue to find the second exhibits (Energized).


Sunlight

Turning sunlight into electricity

Solar panels transform sunlight into electricity .when the sun;s radiation hits the panel, electrons get energized and start move. Flowing electrons create an electrical current. That’s electricity.

This has a solar panel, four different position A,B,C or D in the house.

and three different time of the day (morning) (noon) (Afternoon).

unnamed-6

I started to do the experiment  of those three time of the day, and put the solar panel in the different position to get the data of how much energy  the panel generates.

Morning                  Noon                   Afternoon

position             Energy                    Energy                     Energy

A.                            8.8                           0                                1.8

B                             0                              8.3                              0

c                             1                              5.7                             8.7

D                            1.8                            3                               6.2


The three exhibits

Conserve@Home

This is three different light.

I started to do the experiment.

unnamed-7

I shift plate very fast, and observed the different light.

I observed LED light early  to get energy, but the Incandescent is hard to get energy.

The last exhibits.

Investigate

four steps to do this experiment.

1 Ask a question.

Does the different time that will affect the temperture.

2. Make a guess

Yes. It is.

3. Check it out.

grab-fill-lift-press-watch

4.what does it mean?

The time did not affect the temperature. The time is going, but the temperature is keeping the same during the time passed.

unnamed-8

I went around the museum, and looked the different  exhibits.

I ENJOY this trip.

Iceland’s use of geothermal energy

iceland

Iceland:

Iceland is one of the most dynamic volcanic regions in the world. Shaped by fierce natural forces, straddling the Mid-Atlantic Ridge where the activity of divergent tectonic plates brings heat and magma closer to the earth´s surface, Iceland holds enormous geothermal resources.

Geothermal power plants

There are five major geothermal power plants in Iceland and each of them has an important role; heating up the cold place of Iceland. The plants can produce about 26.2% of energy for the entire country, approximately 87% of heated water for all the establishments and houses, and 73.8% of the electricity provided from hydro power. That is really a very great deal for the locals. Imagine without the geothermal plants, Iceland would be as cold as Ice (literally) and no human being would ever tolerate to stay in such a place especially now when the climate is constantly changing and abruptly increasing or extremely decreasing. With the geothermal power plants in Iceland, it could be a huge change for the future to come in terms of energy supply.

Nesjavellir Power Plant

located at 177 m (581ft.) above sea level on the northeast side of Hengill, supplies 1,100 l/sec of 82-85°C hot water (181.4ºF). The water travels through a 27 km long pipeline (16.78 miles) to the city with a heat loss of only 2°C on the way. It is a combined heat and power plant and provides space heating and hot water for most of the Greater Reykjavik Area. It is the most powerful geothermal well in the world.

Svartsengi Power Plant

is situated in the south-west of the country, near the International Airport at Keflavik on the Reykjanes peninsula. As of 2012, it produces 75 MWe of electricity, and about 475 litres per second of almost boiling water (90°C). The water is also used to heat up the lake of the nearby Bláa Lónið (The Blue Lagoon).

Krafla Power Plant

is situated in the north-east corner of Iceland, near Lake Mývatn (Myvatn) and the volcano Krafla, from which it gets its name. It produces 60 MWe of electricity, with an expansion to 90 MWe planned.

Hellisheidi Power Plant

is located at Hengill, 11 km (7 miles) from the Nesjavellir Geothermal Power Plant. As of Oct 2011, the plant has a capacity of 303 MW of electricity and 133 MW of hot water; target capacity is 400 MW.

Reykjanes Power Plant,

located on the Reykjanes peninsula (15 km west of the Svartsengi Power Plant), produces 100 MWe, 850 GWhe/year, using steam from a reservoir at 290-320ºC. This is the first time that geothermal steam of such high temperature has been used to generate electricity on a large scale, and currently it’s the only high-temperature seawater-recharged geothermal system on a mid-ocean-ridge available for deep drilling anywhere in the world.

Iceland’s use of geothermal energy

pic-3

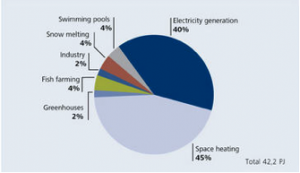
shows the prevalent types of geothermal applications used in Iceland in 2013. Due to extensive district heating network and an impressive power generation capacity, space heating and electricity generation are the main uses of geothermal energy in Iceland, with the diverse industrial, agricultural, and recreational uses described earlier accounting for 17% of geothermal energy utilization in the country.

Generating electricity :with geothermal energy has increased significantly in recent years. As a result of a rapid expansion in Iceland’s energy intensive industry, the demand for electricity has increased considerably.

13-generation

The figure shows the development from 1970-2013. The installed generation capacity of geothermal power plants totaled 665 MWe in 2013 and the production was 5.245 GWh, or 29% of the country’s total electricity production.

http://www.icelandontheweb.com/articles-on-iceland/nature/geology/geothermal-heat

http://www.northernlightsiceland.com/geothermal-heat-in-iceland/

http://insight.gbig.org/energy-generation-in-iceland-part-i-geothermal/

Thermoelectric Devices

634793817546542968

Thermoelectric Devices: is the devices for direct conversion of heat to electricity.

How they work:

Heating one end of a thermoelectric material causes the electrons to move away from the hot end toward the cold end. When the electrons go from the hot side to the cold side this causes an electrical current, which the PowerPot harnesses to charge USB devices. The larger the temperature difference the more electrical current is produced and therefore more power generated.

The tricky part about thermoelectric generators is that as you heat the hot side, the cold side of the generator heats up too. In order to generate power with the a thermoelectric generator you need both a heat source and a way of dissipating heat in order to maintain a temperature difference across the thermoelectric materials. This is done with no moving parts by heating water in the PowerPot. Water holds several times more heat than aluminum per pound, so it makes a wonderful heatsink. Also, water never gets hotter than 212 F (100 C) at a boil, effectively limiting the maximum temperature of the “cold” side of the thermoelectric generator.

Their Application

Thermoelectric power generation requires three major pieces of technology: thermoelectric materials, thermoelectric modules and systems that interface with the heat source.

HOW THERMOELECTRIC MATERIALS WORK

     Thermoelectric materials generate electricity while in a temperature gradient. In order to be a good thermoelectric, materials must have the unique combination of both high electrical conductivity and low thermal conductivity.

HOW THERMOELECTRIC MODULES WORK

     A thermoelectric module is a circuit containing thermoelectric materials that output usable electricity. There are several types of efficient thermoelectric materials, but not all are capable of operating in a power generation circuit, or “module,” under typical waste heat recovery conditions.

HOW THERMOELECTRIC POWER GENERATOR (TEG) SYSTEMS WORK

A thermoelectric power generation system takes in heat from a source such as hot exhaust, and outputs electricity using thermoelectric modules.

Example:

The PowerPot is a thermoelectric generator that uses heat to generate electricity. The PowerPot has no moving parts or batteries, and since the thermoelectric technology is built into the bottom of the pot it can produce electricity from a wide variety of heat sources. Simply add water and place the PowerPot on a fire (e.g. wood, propane, butane, alcohol, gas) and it will start generating electricity within seconds. Just plug in the high temperature cable to the back of the pot and watch your USB devices safely charge from a fire.

The larger the temperature difference between the water in the pot and the bottom of the pot, the more electricity the PowerPot will produce. For example, melting snow in the PowerPot is a great way to generate electricity, because snow is so much colder than a flame. However, you don’t have to worry about overpowering your device, because the PowerPot has a built in regulator which insures that you safely charge your USB devices. The regulator outputs 5 volts (USB standard) and up to 1000 milliAmps of current, which is the most any smartphone/MP3 player on the market can handle. This means when you’re charging your USB device with the PowerPot, you will get the same charging time as you would from your wall outlet at home.


https://powerpractical.com/pages/how-do-thermoelectrics-work

http://www.globaltcad.com/en/solutions/application-tutorials/thermo-electric-device/01-thermo-electric-device.html

https://www.alphabetenergy.com/how-thermoelectrics-work/

solar energy

Solar Energy: Solar energy is radiant light and heat from the sun harnessed using a range of ever-evolving technologies such as solar heating, photovoltaics, solar thermal energy, solar architecture and artifical photosynthesis.

Effect In the United Stated

Solar power is more affordable, accessible, and prevalent in the United States than ever before. Since 2008, U.S. installations have grown seventeen-fold from 1.2 gigawatts to an estimated 20 GW today. This is enough capacity to power the equivalent of 4 million average American homes or to supply the combined electricity needs of Austin, Texas and Seattle, Washington for one year (based on electricity consumption data for 2012). As of 2014, rooftop solar photovoltaic (PV) panels cost about 50% of what they did just three years ago. Since the beginning of 2010, the average cost of solar PV panels has dropped more than 60% and the cost of a solar electric system has dropped by about 50%.

Increased solar energy deployment offers myriad benefits for the United States. As the cleanest domestic energy source available, solar supports broader national priorities, including national security, economic growth, climate change mitigation, and job creation. Solar’s abundance and potential throughout the United States is staggering: PV panels on just 0.6% of the nation’s total land area could supply enough electricity to power the entire United States. PV can also be installed on rooftops with essentially no land use impacts. Concentrating solar power (CSP) is the other method for capturing energy from the sun, and seven southwestern states have the technical potential and land area to site enough CSP to supply more than four times the current U.S. annual electricity demand.

Effect In China

China has emerged as the world’s largest market for solar panels and in 2015 is expected to be home to a quarter of the planet’s new energy capacity from solar panels, according to a new report from GTM Research. China is rapidly adding as much power generation as possible, and solar is just one source of new energy generation in the country.China is expected to install 14 gigawatts of solar panels in 2015 out of a total 55 gigawatts worth of solar panels installed worldwide. In addition to China, countries in the Asia Pacific region are supposed to count for more than half of the world’s new solar panel capacity this year, including many new solar installations in Japan, and an emerging potentially huge market in India. One gigawatt is around the size of a large natural gas or nuclear plant.

China needs as much electricity it can get, and because the country has more recently started to tackle its massive air pollution crisis, solar is seen as a cleaner way than coal to boost the electricity supply. Three gigawatts worth of coal power-producing plants were actually closed in 2014, and 18 gigawatts have been closed to date in the country. China pledges to eliminate 20 gigawatts of coal capacity over the next five years to help with air pollution.

Effect in Japan

Japan is the fourth largest energy consumer in the world.

Japan is the fastest growing nation that is promoting PV and now leads the world Photovoltaic market. In fact, 45% of photovoltaic cells in the world are manufactured in Japan. The benefits for using PV include high reliability, low operation cost, environmental friendly, modularity and lower construction cost. Also a consumer can sell excess electricity that is produced during the day time back to the electric company. To promote PV in households, the Japanese government offers subsidies for installation costs. Japan is also planning the “Energy from the Desert” project — intended to establish large scale PV power generation systems in the deserts in cooperation with National University of Mongolia.

While the installation of PV system is intended for households, most solar thermal are currently installed in hospitals and public institutions. Solar thermal requires large equipment, which is relatively difficult to install in households. Solar thermal systems have multiple uses; for example, water heating, room heating and cool-water exchangers. People can save a lot of money and energy by using a solar thermal heat exchanger instead of typical air conditioner that has high electricity consumption.

Japan Building World’s Largest Floating Solar Power Plant

Kyocera Corp. has come up with a smart way to build and deploy solar power plants without gobbling up precious agricultural land in space-challenged Japan: build the plants on freshwater dams and lakes.

The concept isn’t exactly new. Ciel et Terre, based in Lille, France, began pioneering the idea there in 2006. And in 2007, Far Niente, a Napa Valley wine producer, began operating a small floating solar-power generation system installed on a pond to cut energy costs and to avoid destroying valuable vine acreage.

Kyocera TCL Solar and joint-venture partner Century Tokyo Leasing Corp. (working together with Ciel et Terre) already have three sizable water-based installations in operation near the city of Kobe, in the island of Honshu’s Hyogo Prefecture. Now they’ve begun constructing what they claim is the world’s largest floating solar plant, in Chiba, near Tokyo.

The 13.7-megawatt power station, being built for Chiba Prefecture’s Public Enterprise Agency, is located on the Yamakura Dam reservoir, 75 kilometers east of the capital. It will consist of some 51,000 Kyocera solar modules covering an area of 180,000 square meters, and will generate an estimated 16,170 megawatt-hours annually. That is “enough electricity to power approximately 4,970 typical households,” says Kyocera. That capacity is sufficient to offset 8,170 tons of carbon dioxide emissions a year, the amount put into the atmosphere by consuming 19,000 barrels of oil.

The mounting platform is supplied by Ciel et Terre. The support modules making up the platform use no metal; recyclable, high-density polyethylene resistant to corrosion and the sun’s ultraviolet rays is the material of choice. In addition to helping conserve land space and requiring no excavation work, these floating installations, Ciel et Terre says, reduce water evaporation, slow the growth of algae, and do not impact water quality.


http://www.geni.org/globalenergy/library/energytrends/currentusage/renewable/solar/japan/summary.shtml

http://spectrum.ieee.org/energywise/energy/renewables/japan-building-worlds-largest-floating-solar-power-plant

http://www.technologystudent.com/energy1/solar1.htm