Bryan Vermes - Blog

Just another Blogs.cas.suffolk.edu site

By

BLOG ENTRY: Science Experiment Brainstorming

BLOG ENTRY: Science Experiment 

Cloud-Learning

The Task

Our task today was to begin drawing up potential ideas that will lead us to an informative, challenging, and exciting final experiment. To begin this conversation, my team and I (which includes Jessica Hickey and will be led by Rebecca Eshoo) had an ice-breaking session. We discussed different things we have studied in the class and what we were looking to take away from this assignment. Growing to be comfortable with all parties that will be participating in this experiment is an important step forward in allowing creativity. Following this, we laid out our goals for this presentation:

  1. Create a presentation that is informative and in-line with class material
  2. Ensure that the experiment is doable
  3. Write a procedure that can be easily followed, with the objectives clearly outlined through an effective analysis of recorded data


Discussing Possibilities

Our conversation about what experiment we will put together ranged from the topics of climate change, energy generation, and thermal power. We also touched upon more tech-driven experiments that would require the usage of phones and potentially an iPad. However, as we did go through some of these experiment concepts, we quickly realized that many of them were unrealistic. To create a worthwhile presentation, we needed to ensure that the tools could be acquired and that the information will be readily available within the allotted final exam period.

ItsNotJustTheHeatItsTheOzoneHiddenHeatWaveDangersExposed

Our focus for the presentation will be on heat. While not having details ready at this time, we do have a broad concept for our experiment:

  • Compare insulation of heat with different materials
  • Utilize different liquids to compare the heat capacity of each
  • Analyze the impact such research can have in homes in terms of sustainability and limiting energy leakage


Back-Up Plans

Because we have not tested our experiment yet, it was important for our team to also draw up possible back-up plans. We researched the possibility of experimenting with the greenhouse effect by heating water with different coverings on the top of each container. In addition, we explored the idea of testing energy levels from different food types. We would utilize a program to potentially measure reaction time before and after different calorie consumption with individuals. These ideas will be explored further if the first idea proves to be too difficult.

Conclusion

Our first brainstorming session today proved to be productive and exciting. My team is definitely excited to get to work and see what we can put together for the class to learn from!

By

BLOG ENTRY: Keystone Pipeline

BLOG ENTRY: Keystone XL Pipeline

The pending approval (or disapproval) of the Keystone XL pipeline has become a political football for the past few years. The project (shown in the diagram below) has become less about the facts and more about the rhetoric between Democrats and Republicans.

keystone 1

The Keystone Pipeline already exists, and it runs from Alberta, Canada to Crushing, Oklahoma. What’s pending approval from regulators is a 1,700 miles worth of expansion that would cut into two sections. The first section would connect Crushing, Oklahoma with the Gulf Coast (in Texas). This has gone into operation. The second portion would span from Alberta to Kansas, through the Bakken Shale region. At peak capacity, the pipeline will deliver 830,000 barrels of oil per day. Furthermore, it would offer the benefit of carrying US light crude oil and heavier Canadian oil harvested over tar sands. There is room for further exploration of this heavier oil as technological advancements continue. This second portion of the project is what is currently pending approval from the federal government.

us-department-of-state-34-logo

The application for the pipeline extension was received by the State Department in May 2012, by TransCanada Corp., and the debate has continued since. In coordination with other federal departments, studies have been taking place on the economic and environmental impact of the proposed project.

Despite the potential benefits of increased access to Canadian oil and increased North American energy security, opponents have countered that opening a channel for carbon-rich, Canadian tar-sands oil would increase carbon emissions significantly. To convert the heavier product to usable oil, one of two methods must be used. Separating the carbon and hydrogen rich products, followed by the removal of the carbon rich component, is one method. The other option involves adding hydrogen to increase the hydrogen-to-carbon ratio of the resulting product, by mixing the initial product with a hydrogen-rich compound such as natural gas. Both processes require a significant amount of energy, often fueled by fossil fuels. Furthermore, environmentalists insist that Trans Canada will destroy the local ecosystems in the tar-sands basin.

keystone 2

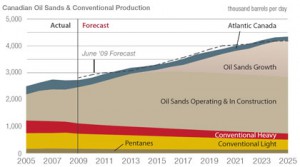
An estimated 170 billion barrels of oil is recoverable, which would accommodate anticipated US demand for over 30 years. Oil production in Alberta tar sands totaled 1.9 million barrels per day in 2012, and is expected to double by 2022. Due to this growth (underscored in the graph above), one third of US imports of petroleum came from Canada in the last year. The potential economic benefits of this oil must be balanced with the environmental concerns discussed prior before a final decision is made.

While being sympathetic to environmental issues, I would urge the American government to approve the Keystone Pipeline extension. The proposed project would create 2,000 jobs, in addition to the added energy security. Furthermore, well over 60% of the public is polled to have support for the project. Specific poll numbers are shown in the pie chart below this paragraph. Disapproving the pipeline would not stop exploration from expanding in Canada (a sharp increase in carbon emissions from the region already is proof of this). Instead, we would simply be taking ourselves out of the group of parties that would directly benefit from the exploration. To address longer-term energy and carbon concerns, the US should still move forward in imposing strict new standards on power plants and increase car standards. This ensures that fossil fuel providers are not receiving a unconditional approval for their projects. Pairing these decisions together would address short-term energy demands, while concurrently limiting carbon emissions in the long-term.

keystone 3


References:

http://stateimpact.npr.org/texas/tag/keystone-xl-pipeline/

http://www.keystonepipeline-xl.state.gov/

http://harvardmagazine.com/2013/11/the-keystone-xl-pipeline

http://www.latinpost.com/articles/8522/20140308/keystone-xl-pipeline-project-pros-cons-facts-recent-poll-shows.htm

http://www.nationaljournal.com/congress/keystone-xl-pipeline-just-the-facts-20111208

By

BLOG ENTRY: The President’s Plan

BLOG ENTRY: The President’s Climate Plan


Cutting Carbon Emissions from Power Plants

The EPA’s movement forward to limit carbon emissions from power plants has caused the greatest controversy of the president’s plan. Despite a Supreme Court ruling that the EPA actually has an obligation to protect the public’s health and limit carbon emissions in some form, backlash has continued to be strong (especially from coal supporters).

graph 1

Analyzing the carbon data coming from the US, it’s absolutely essential that we take the lead in limiting carbon emissions. A huge portion from our carbon output is from power plants. If we want to tackle this problem, how is it possible to do so without targeting one of the largest sources of emissions? The graph above shows that progress is slowly being made, but there is still a significant amount of work to be done.

garph 2

As stated in the class text, attempts to limit carbon emissions from things like airplanes are fruitless if we are to ignore the glaring problem of inefficient electricity production. Furthermore, American coal and natural gas plants have the technology available to vastly improve carbon output levels. There needs to be a cost incentive for these plant operators to make available upgrades, and harsher penalties from the EPA is a step in the right direction. The pie chart above underscores the importance of electric power generation being an area where we see improvements. EPA action would allow us to move forward.


Increasing Car Efficiency Standards

The Obama administration should be applauded for taking the lead with reducing carbon emissions from vehicles, while concurrently boosting efficiency significantly. With an aim of having 54.5 MPG efficiency for passenger cars by 2025, the US has restored itself as a role model for the international community in regards to protecting the environment (in the area of transportation).

graph 3

The increase in fuel standards (shown in the above graph) is expected to reduce emissions by the amount that the country emits in one year in total. This is a significant improvement over the status-quo, and underscores the ability for targeted measures to also be effective measures. Big legislation may accomplish more, but executive action can still be put to use in protecting the environment.

Following the announcement of US measures, China and India have also announced action to increase fuel standards to levels comparable to America’s 2025 goal. This highlights the ability for the global community to come together and address an energy and climate crisis in an effective manner.


Boosting Investment in Renewable Energy

The US has had serious problems with investing consistently in renewable energy. Obama’s plan to streamline permitting and continue basic investment into these forms of energy is a promising start. However, a broader plan should be put into place to ensure that the wind and solar sectors are not subject to the pressures of partisan politics. It’s embarrassing that China is showing off more elaborate solar and wind projects than the US, when the US has already long transitioned into a service economy and has more flexibility to promote such fuel usage. The graph below shows the positive development of continued government support of wind power.

graph 4

With that stated, and as pointed out in the class text, it’s important that our energy policy also promote efficiency improvements. This would mean a continued investment in natural gas as a replacement to coal, and more research into carbon capture technologies. An all-the-above solution is more viable for achieving energy needs while also reducing carbon emissions.

The US has made some great strides in the past 4 years to restore its standing as a leader when it comes to environmental issues. While our climate policy is still in-flux, the drop in carbon emissions in recent years should provide hope that we can still meet this challenge.


References:

1)      http://www.whitehouse.gov/climate-change

2)      http://www.autonews.com/article/20131205/OEM11/131209907/u.s.-to-help-china-crack-down-on-vehicle-emissions

3)      http://www.renewableenergyworld.com/rea/blog/post/2013/04/obama-budget-proposal-calls-for-nearly-1b-in-clean-energy-spending

4)      http://www.epa.gov/climatechange/science/indicators/ghg/us-ghg-emissions.html

By

BLOG ENTRY: Science Museum Visit

BLOG ENTRY: Science Museum Visit

Introduction

Visiting the Boston Science Museum offered the opportunity for the class to build upon our knowledge of sustainable energy. Instead of a lecture, we utilized different tools at the varying exhibits to further enhance our understanding of the material and learn about other new technologies. Joined by Rebecca, I was able to enjoy the hands-on learning experience to the fullest extent possible!


Catching the Wind

The wind energy exhibit was incredibly interesting and provided a wealth of information. While it’s often a core energy source debated as the US works to improve its national energy policy, understanding of how we actually generate the power from the turbines is sometimes limited.

IMG_2083

The first tool we interacted with is a wind generator that highlighted the amount of speed needed to generate power (shown above). According to the diagram, only 5-12mph speeds are needed to begin wind energy generation. It felt lighter than what we had felt outside when coming into the museum! Furthermore, the exhibit pointed out that wind energy is actually a form of sun energy. The uneven distribution of heat from the sun onto the planet causes the warm air to rise in some places, which is then replaced with cooler air. This phenomenon creates wind, which we use for our energy.

Further, a second tool put on display were gears that highlighted the amount of power that can be generated. The large rotation of big gears allowed the smaller gears to generate more electricity! This same concept is applied to different wind turbine designs, such as the very-efficient Proven 6 model wind turbine.


Energize!

The second exhibit we visited was centered on an analysis of solar energy. Sometimes linked together with wind power in the great energy debates, the exhibit provided a wide range of hands-on learning tools. Further, it also focused on other energy sources and the need for a diversification of energy sources. This provided a realistic analysis of what can be done to create a cleaner, more-efficient power supply.

IMG_2095

The most interactive tool that I used (shown above) was simple: Power a city using a set number of energy sources. However, the amount of environmental destruction and the amount of energy produced had to be balanced. If the energy plan was too one-sided, the model reset itself. If a viable energy solution was created, the city above the model would light up. As much as I wanted a city that relied fully on renewable energy, I quickly realized the city was never going to be powered! I instead created a balanced energy plan that was green and realistic. This tool helped refocus my views on energy sources to be more realistic with current energy demand.

Another tool available allowed us to shine light on different parts of a solar house, and there was a measuring tool provided to indicate how much power was being produced. Different parts of the house would receive the light at different angles, and there were objects that could be used to cover parts of the solar panels. This tool underscored the importance of a reliable, steady amount of solar light for this energy source to be a sizable producer. Without a means to store the energy, it would be impossible to fully utilize solar power to its greatest potential. However, with technologies moving forward in that area, that obstacle may be tackled soon!


Nanotechnology

The nanotechnology exhibit showed how far we have come in terms of using atoms as a means to produce usable goods. From cancer treatments to future solar cells, nanotechnology offers a pathway to greater efficiency and life-saving technologies. Further, it’s already being utilized today to enhance our daily lives.

The biggest information piece I got during this exhibit is the potential nanotechnology has to dramatically change cancer treatment. According to the diagram, future cancer treatments might be able to use tiny gold nanoshells and infrared light to fight tumors. Further, there is hopes that this technology could be used cure a wide range of other illnesses that have been difficult to address!

IMG_2099

A quote displayed (shown above) in the exhibit captures the core idea: “Nanotechnology allows us to build things the way nature does-Atom by atom.” This area of research unlocks countless opportunities for advanced technological development. It’s used already in sunblock and in computer chips, so it’s going to be interesting (and fun) to see where it heads next!


Conserve at Home

The Conserve@Home exhibit opened my eyes to the amount of waste that’s in every house in this country! More than ever, we need to focus on the three key concepts highlighted in this exhibit: Reduce, reuse, and recycle.

IMG_2104

I spent much of my time in this exhibit shocked by the amount of power a hair dryer uses! Yes, a hair dryer! A tool (shown above) provided in the exhibit related draining water to the amount of energy drained through every-day house appliances. The hair dryer, at 1,000 watts, drained the energy source incredibly fast. It made me feel rather guilty for how much time I spend on my hair!

This exhibit also focused on providing the information needed for individuals to make better decisions. For example, diagrams that showed how water bottles could be used to make bridges and jackets underscored the absolute importance of continuous recycling of plastic. Further, an energy audit display showing leakage of heat from a home pointed out the importance of insulation and energy efficient building codes.


Conclusion

The visit to the Boston Science Museum gave us a chance to learn about sustainability and future technologies outside of the classroom. I had not gone in many years, so this was definitely a refreshing and fun experience! The information provided will allow me to make better decisions about my energy usage in the future.


Skip to toolbar