Bryan Vermes - Blog

Just another Blogs.cas.suffolk.edu site

By

BLOG ENTRY: Pandora’s Promise Review

BLOG ENTRY: Pandora’s Promise Review

MV5BMTgyNDYxMzQxM15BMl5BanBnXkFtZTcwODQ0NTY0OQ@@._V1_SY317_CR0,0,214,317_AL_

Introduction

Pandora’s Promise offered a polarizing introduction with a quote from an anti-nuclear protester, and carried on to provide an in-depth look in the nuclear energy debate. I truly enjoyed the opportunity to immerse myself in the stories of those who’ve had conflicting views about nuclear power, as I have had myself. Further, the film’s utilization of a wide-range of different topics (from nuclear weapons, to global warming, to the different kinds of nuclear reactors) helped build on my base knowledge of the nuclear energy industry.

Before delving into the specific topics discussed in the film, on a broader scale I appreciated the natural presentation of the facts. Rather than feeling like the movie was a propaganda piece, it was instead an interesting and informative movie that allowed for my own opinions to be tested.

Review: Specific Topics Covered

Nuclear Proliferation

russianmissile_cc_050814

The topic of nuclear proliferation was hit strongly in this film, as it’s one of the biggest issues facing nuclear power proponents. While I’m skeptical of monitoring capabilities, I concede that the film did dispel many of my concerns about the ability for these nuclear power facilities to be utilized easily to build dangerous weapons. I learned that many old Russian nuclear warheads are now being recycled to be used in reactors for usable energy! With that said, a broader range of interview from those in the security field at the Pentagon would have allowed a different perspective on this issue.

The United Nations offers the globe a wide range of tools to punish nuclear activity that could endanger public safety. Highlighting more of these specific tools, specifically the research done by the IAEA, would have assisted in further grasping the magnitude of the nuclear proliferation threat.


Climate Change

Climate change is the key to the current energy debate, and the nuclear debate. Pandora’s Promise focused on this message, and it’s something that resonated with me through the film. While nuclear power has its downsides, which was indicated at multiple points, the clock is ticking for action on climate action. Renown environmental activists such as Stewart Brand assist in making the green-driven case for nuclear energy. Specifically, the increase in carbon emissions from the developing world could be contained (with decreased levels of poverty) if we allowed for greater usage of nuclear power. This win-win is an area I’m glad the movie covered, as it’s the central argument that could be used to promote nuclear power.

The Obama administration, and government bodies across Europe and Japan, all highlighted nuclear power as a means to combat climate change. It’s imperative that these arguments are backed up with carbon emission goals, and the amount of progress that nuclear power will contribute to specifically.


Nuclear Accidents

APP2000022281187

The Chernobyl (shown above) and Three Mile Island accident are both important nuclear accidents that deserved greater analysis in this movie. While understanding that Western nuclear plants are often ore secure than what was put in place at Chernobyl, safety is still a concern for communities where proposed nuclear plants would be built. To strengthen the case for nuclear power, there should be a greater emphasis on safety standards put into place at an international scale. Questions about what makes Western plants different need to be answered more clearly.

The movie did utilize many scientific experts who had their own varying views. For example, Mark Lynas highlights the concerns from the Fukushima nuclear crisis. However, despite these potential costs of nuclear power, Lynas continues to make the case as to why nuclear power also offers so many benefits to the public. This offered an objective view on nuclear safety that allowed myself as the viewer to feel that the facts being stated were accurate. Further usage of these expert opinions, paired with an understanding of safety laws already in place, would likely bring about greater demand for nuclear power.

Conclusion

Nuclear power in the United States specifically is seemingly underutilized. This fuel source offers an opportunity for the public to tackle the climate change issue while concurrently bringing safer, more reliable energy to our homes. While there is a cost, especially in monetary terms as indicated by Michael Shellenberger, other energy sources are seemingly more damaging. Pandora’s Promise offered expert views on the benefits and costs of nuclear power. At points, I wish there would have been a greater usage of experts from a more expansive range of industries that may oppose further usage of the energy source. With that said, there was a broad range of different studies and historical information that presented a strong case (in my view) for quickly expanding nuclear power capacity. I would urge more advocates to use facts, research, and objective data (like in this film) to argue their case further. Admittedly, I was a nuclear skeptic going into this movie. Following my viewing, I am certainly more open to the expansion of this energy source.

By

BLOG ENTRY: MIT Nuclear Facility Visit

BLOG ENTRY: MIT Nuclear Facility Visit

0321reactor

Visiting the MIT Nuclear Reactor (shown above) provided an opportunity to see the facilities we have been discussing in class in person. I had been completely unaware that we had such research reactors available in the country! Instead, I had imagined all nuclear reactions taking place in huge nuclear power plants. These facilities, from what was discussed during the tour, really provide us the tools we need to do all forms of research. From medical to energy production analysis, this trip underscored the importance of continued research funding by the government.

Initial Impression

Entering the actual reactor itself was very interesting. I learned from just that initial moment that these reactors required a different amount of air pressure. That’s a small detail I didn’t know, but something (that if changed) would probably cause so many problems inside the reactor! Further, the layers of radiation checking/scanning truly made it a surreal experience that seemed straight from the movies. Some things can be exaggerated, but the precaution taken at these types of plants certainly were not! Varying forms of radiation measurements, and the real-life usage of a Geiger-counter, added a hands-on learning experience with what we had discussed in class and from Tom Vales’s lecture.

Tour

Our tour guide provided an enthusiastic and informative session. The biggest takeaway I had was the amount of medical research that can be conducted at a nuclear reactor. When I had imagined radiation being used for cancer treatment, I didn’t imagine the rays they had set up at MIT.  There were posters that demonstrated how such medical treatments would take place, and they offered a detailed look at research-driven operations. Further, it was unfortunate that it seems that research is often driven by interest fueled funding more-so than healthcare needs. This tour re-energized my view that basic scientific research needs to be receiving more consistent support.

controlroom_540x358

The next part of the tour that I found to be most interesting was the control room (shown above). It looked like something that could have been inside of submarine! However, the work being done in those rooms are so incredibly important to the safety of those working in and around the reactor. I simply cannot imagine how big those rooms may be in a larger nuclear facility that’s consistently at critical energy levels. From the demonstration we received, it surprised me that none of the tools was computer-generated. This provided security against potential cyber threats, although newer technologies are now being tested with software.

Lastly, I noted the amount of security precautions taken even for those who seemed to be comfortable in the facility. There was multiple layers of personnel monitoring the equipment, in addition to individuals wearing protective gear around the top of the reactor. While it didn’t provide me with an answer to the nuclear safety question, it brought to my mind the question of the potential that nuclear power plant security concerns are overblown. The tour guide underscored the amount of radiation put into the atmosphere from different byproducts of coal mining and other energy sources, and I found that to be an argument often not used by advocates of nuclear power. Nuclear energy isn’t the only form of energy production that ultimately leads to radiation output, and that’s an important detail in the broader energy debate!

Conclusion

While it’s interesting to read and write about the potential pros and cons of nuclear energy, it’s a great experience to go to a facility and get up close and personal. The realization I had with this tour, as I implied earlier in my blog, is that there seems to be an information deficit with nuclear power. I have consistently viewed radiation as something inevitable with nuclear power exclusively, and linked that with overall fear of nuclear power utilization. However, given a broader realm of information on radiation and actually seeing the safety measures in action, my views are continuing to evolve. I am incredibly lucky to have been able to see the facility, and am glad to walk away with a more grounded opinion on nuclear research and the potential benefits. These reactors provide a great amount of information that will likely lead to safer medical uses of radiation and a greater amount of secure nuclear power in the future.

By

BLOG ENTRY: Tom Vales Demo Summary

BLOG ENTRY: Tom Vales Lecture

safety-sign-radiation

Introduction

Tom Vales’s lecture covered a broad range of information that I had never been “exposed” (pun) to prior! From hearing about uses of nuclear energy, to specific forms of radiation that are very dangerous, I was excited to learn from him. Nuclear power is an issue I’ve been torn with for years, so this lecture provided with increased insight on the benefits and potential costs of this energy source.

Specific Facts Learned

First and foremost, Vales underscored some basic definitions in our discussion of radiation. A radioactive element is in constant decay and is unstable. Furthermore, he highlighted that it came in three forms: alpha (2 protons, 2 neutrons), beta (electron), and gamma (electromagnetic) rays. The radioactive elements seek to stabilize to lead, and their overall threat to the public can be measured through their half-lives.

Tools/Demonstration

Vales utilized his geiger counter to measure radioactivity. The following is a partial list of different objects he measured with his tools:

  • Vaseline glass
  • Fiestaware products
  • Flower cases
  • Phone pole cover
  • Arium pills
  • Uranium ore

These are just some of the things we got to see be measured. Further, he demonstrated the radioactivity with a UV flashlight. I had never known that so many household items gave off radiation decades ago. From thorium to radium, these manufacturers truly posed a threat to the general public. I’m certainly more grateful for government agencies today that protect against abusive consumer practices.

Conclusion

Vales’s demonstration was a great blend between providing the basic information needed to understand radiation and offering a real commentary on the usages of it. The discussion of radiation has always been centered around nuclear power plants and weapons, when not too long ago the threat was often in people’s homes! I am glad I got to listen to this eye-opening lecture!

By

BLOG ENTRY: Fukushima Daiichi Nuclear Disaster

BLOG ENTRY: Japanese Nuclear Power Incident

The Fukushima Accident was one of the most high-profile nuclear accidents in recent memory, and restarted the debate on the potential safety threats of aging nuclear reactors worldwide. Following an earthquake, a tsunami disabled power supply/cooling of three Fukushima Daiichi reactors. This caused a nuclear accident, because all three cores melted within three days.

The tsunami countermeasures that were put into place during the construction of the nuclear plant were seen as being satisfactory, given the research and knowledge at the time. However, despite increased awareness of the threat posted to the plant by 2011, action was still not taken by the plant owner (Tepco). Tsunami countermeasures could have been reviewed in accordance to IAEA standards, but the plant operator chose to continue operations as-is.

fukushima radiation

A more release of radionuclides, including some that are long lived, occurred in March. Much of this was due to a hydrogen explosion in one of the suppression chambers. While radiation has been reduced now, thousands had to be evacuated at the time due to health fears. The image above shows the radiation by the nuclear power plant, and the change in exposure from 2011 to 2012.

fukushima evac

While the nuclear operator was criticized for the lack of updates on the facility, the evacuation plans were put together swiftly and implemented in a timely manner. The impact on human life was limited with the response. Above, a WNN image highlights the quick-changing evacuation measures put into place following the nuclear incident.

Moving beyond the disaster, which caused international concern about the future of nuclear energy, Japan has now recently approved the construction of another nuclear power plant. Japan’s nuclear regulatory agency has declared that atomic power plants are safe to operate. The government has stated that new nuclear power plants are subject to increased scrutiny of security protocol, despite concern from the general public about possible health risks in the future. Opponents of the restart said the agency was essentially overriding public opinion. Furthermore, many have asked for more independent agencies to review Japanese nuclear standards.

nuclear plant

The restarting of nuclear reactors (one is shown above) in Japan is a reversal of the previous administration’s goal of having zero nuclear power in the near future. The new energy plan, which also calls for less “dependence” on nuclear power, calls for increased utilization of other renewable fuels. Over the next three years, the government will be more heavily supportive of solar and wind power. The energy plan was subject to criticism from political opponents due to what was called a lack of specifics. The plan did not include any percentage targets for how much solar or wind power should be deployed as part of the nation’s energy supply.

abe

The cost of imported fuel into Japan has increased sharply (by almost 4 trillion yen), and this has added political pressure for the government (headed by Prime Minister Shinzo Abe shown above) to focus on restarting nuclear power plants and decreasing reliance on international trade. The adoption of the new energy policy has been seen as a piece of a larger economic development plan, as the country still struggles to sustain stable economic growth. Growth will be partly fueled by decreasing energy costs, brightening the prospects for nuclear power in the future.

References:

http://www.world-nuclear.org/info/safety-and-security/safety-of-plants/fukushima-accident/

http://www.newscientist.com/special/fukushima-crisis

http://www.psr.org/environment-and-health/environmental-health-policy-institute/responses/costs-and-consequences-of-fukushima.html

http://www.nytimes.com/2014/09/11/world/asia/japanese-nuclear-plant-declared-safe-to-operate-for-first-time-since-fukushima-daiichi-disaster.html?_r=0

http://www.japantimes.co.jp/news/2014/04/11/national/cabinet-oks-new-energy-policy-kills-no-nuclear-goal/#.VBL2e_ldX_M


By

BLOG ENTRY: Geothermal Energy in Iceland

BLOG ENTRY: Geothermal Energy in Iceland


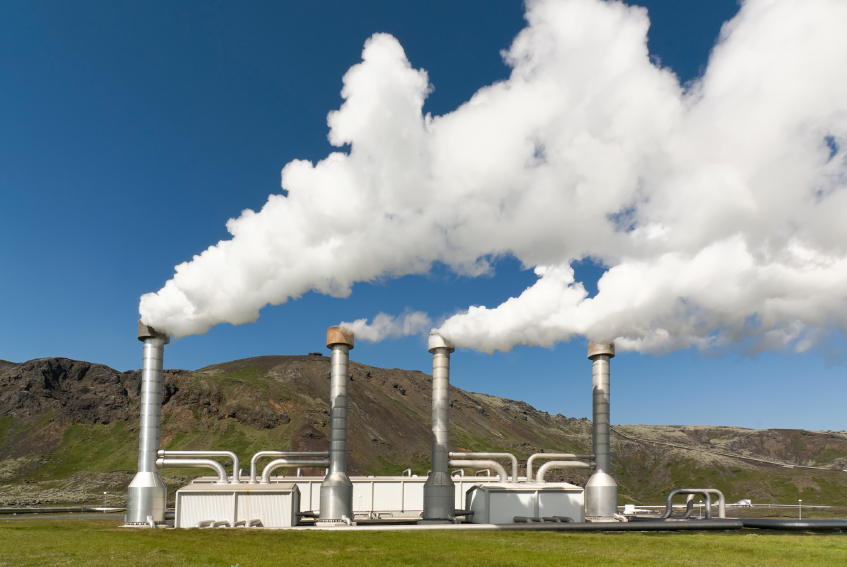
Geothermal energy has been used for thousands of years in a wide range of countries. It’s power that is derived from the earth’s internal heat. This energy comes from under the earth’s crust, and it can be found from more shallow ground to many miles below the surface. The steam and hot water is often used to generate energy for homes and businesses.

Iceland is a leader in the utilization of geothermal energy to heat homes and fulfill electricity demands. Currently, 25% of the electricity production comes from geothermal sources. This is a big turnaround from the 20th century, when Iceland was much more poor and imported vast amounts of coal from Europe for energy demands. In 2011, 84% of primary energy in Iceland came from renewable sources. Over 60% of that was geothermal energy.


Space heating is the main utilization of geothermal energy. Bathing, snow melting, and heat pumps are also key usages of the energy source. Iceland’s government has sponsored research into continuing to deploy more renewable energy to satisfy the country’s energy needs. Production in 2012 was 4,600 GWh.
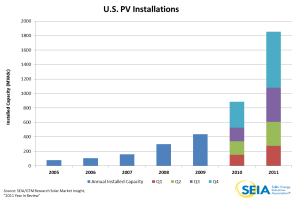
 

Geothermal energy is being utilized by a wide range of industries in Iceland. Fish farming, industry, and recreational swimming uses make up smaller portions of the utilization of the fuel. On the other hand, as discussed earlier, space heating and electricity generation are key usages of the fuel source.

Interestingly enough, while the rapid implementation of the renewable fuel has garnered Iceland international praise, it has also created a lot of political tension. Many firms worldwide have grown interested in exporting the fuel source to countries like the UK, however many in the country oppose exporting the resource. A $1 billion dollar connector between the UK and Iceland was proposed to allow for the usage of the clean fuel in parts of that country, but only preliminary research has been completed thus far.

Geothermal energy as a whole offers many benefits. It can be extracted without signfiicantly damaging to the world’s climate system. Geothermal fields as a whole produce about 1/6th the amount of carbon that other fuels emit. Furthermore, unlike solar and wind power, the energy is reliable and stable. Lastly, the fuel is relatively inexpensive. While other energy sources are undergoing expensive research, geothermal has proven to be a consistent and dependable energy supply for Iceland.


Expansion of geothermal energy usage is likely to continue, due to the research that was conducted by Iceland Deep Drilling Project. Researchers used magma to generate high-pressure steam, which was used to create usable energy. The project produced 36 megawatts of energy! This is the first time that molten magma, instead of solid rock, was used to generate energy. Many believe this research will make geothermal a viable alternative for many more countries in the future, as further advancements are made and costs continue to decline.


Resources:

http://www.nea.is/geothermal/

http://www.renewableenergyworld.com/rea/blog/post/2013/03/geothermal-energy-in-iceland-too-much-of-a-good-thing

http://environment.nationalgeographic.com/environment/global-warming/geothermal-profile/

http://waterfire.fas.is/GeothermalEnergy/GeothermalEnergy.php

http://thinkprogress.org/climate/2014/02/04/3241811/iceland-geothermal-magma-energy/

http://www.scientificamerican.com/article/iceland-geothermal-power/

By

BLOG ENTRY: Stirling Engine/Peltier Device

BLOG ENTRY: Stirling Engine/Peltier Device


Stirling Engine

A stirling engine is a heat engine that operates via cyclic compression. An expansion of air/another gas at different temperatures causes a net conversion of heat energy to mechanical work. It was a rival to the steam engine, and was usually used for low-power domestic applications. With that said, it’s known for high efficiency when compared to other forms of steam engines.

Steps to a stirling engine:


  1. Utilization of sealed cylinder with one part hot and another cold
  2. Working gas inside the engine, which is usually helium/hydrogen/air, is moved from the hot side to the cold side
  3. The gas on the hot side expands and pushes up a piston
  4. Gas cools down on the cool side, contracting
  5. Two power pulses per revolution supplies smooth energy supply

It’s able to use almost any heat source, which allows it to be compatible with a wide range of renewable fuels. This has become increasingly acknowledged as fuel costs of conventional fuels have risen.


The heat driving a stirling engine has to be transmitted from a heat source to working fluid. Each stirling engine system must have a heart source, a heat “sink,” and multiple heat exchangers. The heat source can be provided from combustion.

The key difference between this form of combustion and most other engines is that the stirling engine can run on fuels that would usually damage other engine internals. This is because the working fluid doesn’t have to come in contact with the heat source. Concentrated solar energy, nuclear energy, and geothermal energy have all been identified as uses for the stirling engine.


Despite its efficiency, the stirling engine isn’t widely used in vehicles because it’s difficult to start instantaneously. However, they still continue to have widespread use as cooling devices. If a machine is designed correctly, the stirling cooler can go as low as 10 degrees Kelvin. Micro stirling coolers have been produced for cooling infrared chips in night vision devices. Furthermore, stirling engines are still found in submarines. Expansion of their usage with greater utilization of renewable energy may be possible in the future.


Peltier Device

A Peltier device utilizes the “Peltier effect,” which is heating/cooling at an electrified crossing of two different conductors. As the current flows through the junction, heat may be generated/removed. Heat pumps utilize this concept, while thermoelectric cooling is found in refrigerators.


Steps to a thermoelectric cooler:

  1. Implementation of the theory that heating and cooling effect occurs when electric current passes through two conductors.

  2. Voltage is applied to the free ends of two different materials to create temperature difference

  3. Peltier cooling causes heat to move from one end to another

  4. As a DC current passes through one ore more pairs of elements from each side of the conductor, there is a decrease in temperature at the junction (cold side)

  5. This causes an absorption of heat from the environment

  6. Heat is carried through cooler by electron transport/released on opposite hot side


The thermoelectric effect is the conversation of temperature differences using electric voltage, as found in the devices mentioned prior. The effect can be used to generate electricity. The production of heat from electricity is called the Seebeck effect. The Seebeck effect can be reversed, when a direct current is sent through the circuit where two dissimilar conductors are joined. As stated in the steps, heating will take place at one of the junctions and cooling at the other.

In addition to the uses mentioned prior (heating and refrigerators), thermoelectric applications include temperature difference detection and thermal energy conversion. The coolers specifically can be used for applications that require heat removal. This can span from small amounts to several thousand watts! Both tools discussed have a wide range of modern uses, despite their creation several years ago!

References:

By

BLOG ENTRY: Solar Cell Lab Analysis

BLOG ENTRY: Solar Lab Reflection

The Mission of Our Experiment

Our solar generation lab was utilized to continue building on our foundation of knowledge about solar energy (specifically that we had gotten from the class text). In addition, we were working to understand the relationship between voltage output of a solar cell and light intensity. Key question: How would distance, which we utilized to change intensity, impact voltage production? Further, what colors of light provide greater levels of voltage?

The experiment was to be used to confirm the conclusion that light intensity is positively correlated with voltage produced. With greater intensity, there will be greater voltage. The graphs shown later in this blog entry emphasizes these findings.

How did the lab focus on this issue?

Our lab focused on the different wavelengths of energy hitting the solar panel (through the utilization of color filters) and on the distance from the light source. The distance of the light source was underscoring the importance of light intensity.

These two different variables allowed an in-depth exploration of how energy wavelengths and light intensity impact the amount of voltage produced from a solar cell. Light intensity and the wavelengths from the source impact the speed of the voltage/current.

Trial Set One: Changing Distance

In the first six trials, we used LabView to measure the amount of voltage produced on the solar cell while altering the distance away from the solar cell. In these trials, we left the light unfiltered. The only variable changing with the experiment was the distance between the light source and the solar cell (which was measured by a ruler in centimeters).

Through our understanding of the relationship between light intensity and voltage produced, we concluded (before the experiment) that there would be a decrease in voltage produced as we increased the distance between the solar cell and the light source. This was an inverse relationship.

The table and the graph below indicate the relationship between the distances we used and the amount of voltage recorded on LabView:

Distance (CM) Average Voltage

0

0

0

0.407417

2

0.385606

4

0.359946

6

0.335569

8

0.334286

voltage vs distance

As we had expected, as we increased the distance between the solar cell and the light source, the amount of voltage decreased. This is what we expected due to the diminished light intensity as light intensity is directly correlated with voltage production.

Trial Set 2: Filtered Light Source

For our second set of trial runs, instead of changing the distance between the light source and the solar cell, we filtered the light source. We left the distance constant, by pressing the light source directly onto the solar cell. To analyze the impact of the color of the light source, we used four different colored tinted sheets: Blue, green, red, and yellow.

This experiment built off of our class lecture understanding that different wavelengths of energy will go through to the solar cell with different tinted sheets:

Wavelength Map

Analyzing the class diagram, we concluded that the colors with longer wavelengths have a lower amount of energy. We inferred that the filters of the darker colors would produce smaller voltage. This is because we noted that silicone solar cells absorb less of the higher energy, and are more able to generate voltage with red/yellow colored radiation.

The table and graph below indicate the voltage recorded by LabView during each color-filtered trial run:

Color Average Voltage
Blue

0.330437

Green

0.3544814

Red

0.357812

Yellow

0.386889

voltage vs color

The graph and table confirms our understanding that the light filters (red/yellow) led to greater current and voltage production. On the other hand, the darker filters decreased the amount of voltage produced.

How did this heighten our understanding of voltage produced in a solar cell?

This experiment underscored the relationship between light intensity and voltage produced. There was a clear, defined positive correlation between the two. In addition, it also highlighted the speed of light formula that implied the wavelength of energy would significantly impact the amount of voltage produced. As we filtered the light source with darker colors, the amount of voltage produced decreased as the silicone solar cell was more receptive to the red/yellow filters. These two relationships built on our knowledge of solar energy prior.

Conclusion

This lab was a unique and interesting way to further enhance our understanding of solar cells. Because this form of energy is being increasingly utilized, it felt timely and appropriate! The lab went smoothly for Rebecca and I, and was definitely one of our favorite experiments so far!

By

BLOG ENTRY: Solar Power Projects Worldwide

BLOG ENTRY: Solar Power Projects Worldwide

Often discussed as one of the pathways out of the global climate crisis, solar power has had mixed success worldwide. Deployment is moving swiftly in the United States and China, while investment in the source has essentially collapsed in some countries such as Japan. Despite years of debate over tax credits and the need for development of more energy storage technologies, solar power is still rapidly growing as a source of electricity for the global economy.

solar-panels-homepage

Beginning with an overview of the two different forms these energy projects are under, they center around either solar thermal collectors or photovoltaic cells. The latter is more complicated and has been the subject of more intense research in recent years. The collection of thermal radiation involves the use of a fluid passing through a heat sink, which is exposed to sunlight. This can be used as a heat source, or can be concentrated in a turbine to generate energy. Photovoltaic cells use semiconductors to convert protons to electrons, which then generates energy.

Furthermore, photovoltaic systems are becoming more popular. The silicon solar cell was initially developed in the 1950s. While initially being very expensive, development has been continuous and more affordable options are now available. Unfortunately, this has led to less efficiency on some of the systems. A simple diagram of a photovoltaic system is shown below.

photovoltaic_system

In the US, solar energy has played a minor role since the advent of industrialization. It provides three tenths of 1% of energy consumed in the United States. Deployment has rapidly grown in recent years, with support of the government. Capacity has increased from around 330 megawatts in 1997 to over 6,000 in 2013.

The main drawback to solar power deployment has been a lack of constant supply and reliability. Changing positions relative to the sun, and atmospheric conditions, have led to concerns about the stability of solar power. Furthermore, a significant amount of energy is lost as it is transported through power lines. The cost of the technology for solar power, relative to the energy produced, makes the source expensive when compared to other alternatives. As highlighted in the class text, a typical system for a single residence carry about a 3-5 kW capacity. The cost runs as high as $8,000 per kW, bringing the cost beyond $40,000.

091009_googlesolar

This doesn’t leave solar power without its believers. A key American project is taking hold with a high-profile corporate backer! Google is investing to convert an old oil field into a solar power plant. They are providing about $145 million dollars in financing, so SunEdison can build the plant. Google has been a strong backer of renewable energy in the past, and the plant will be able to power 10,000 homes. It will be the 17th renewable energy project that Google has invested in, underscoring the importance of partnerships between different private firms to increase deployment of solar power.

Projects like these has pushed solar power to the level of being able to power more than 2 million American homes. There were 140,000 new solar power installations in the country in 2013.

2011 Year in Review Chart

The graph above underscores the increase in American solar capacity in recent years.

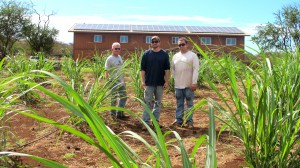
Looking away from the mainland US to Hawaii, a solar-powered vodka distillery has caught the attention of the web. The vodka is distilled from sugar cane and blended with deep ocean minerals from the depth of 3,000 feet off the coast. The entire operation is powered by a 61.2kW solar PV array. According to the company, 100 percent of their power comes from solar power and relies on lithium ferrous phosphate batteries.

IMG_27612

The project has been used by solar power advocates to point to what is possible at a larger scale, given greater investment in the energy source. Environmentalists underscore the broad, 360-degree approach at environmental protection within the context of solar energy. The distillery is able to generate power without the destruction of a broad area of forest, and is concurrently limiting carbon output.
India-to-get-first-floating2

Lastly, the final project I’ll be analyzing is across the world in India. The country is planning the world’s first floating solar power project. India’s leading hydropower generator, National Hydro Power Corporation, is planning to set up a 50 MW solar photovoltaic project, which will be over bodies of water. The cost of the project will be around $70 million dollars. The floating solar power plant technology was developed by a team led by SP Gon Choadhury. There are hopes that this project will provide a template for future floating solar power plants in the future.

While solar power provides a small portion of the American and global energy supply, its growth is noteworthy and likely to continue. With continued cooperation between different stakeholders, and the advancement of deployment technologies, the energy source will likely be seen as a more viable alternative in the future.

References:

http://www.renewableenergyworld.com/rea/blog/post/2013/11/top-five-cool-renewable-energy-projects

http://www.huffingtonpost.com/2014/09/10/google-solar-power_n_5796580.html

http://instituteforenergyresearch.org/topics/encyclopedia/solar/

http://www.seia.org/research-resources/major-solar-projects-list

http://www.seia.org/research-resources/solar-industry-data

http://cleantechnica.com/2014/07/02/india-plans-worlds-largest-floating-solar-power-project-50-mw/

By

BLOG ENTRY: Energy Generation Lab Analysis

BLOG ENTRY: Generator Lab

What was the goal of this lab?

The main objective of this lab was centered around Faraday’s Law. This law states that changing magnetic fluxes through coiled wires generate electricity. When you increase the changes in magnetic flux, the greater the currents and the voltages will be. Our lab was set up to allow us to explore this relationship between magnetic fluxes and current, and see the positive relationship between the two variables.

How did we do this?

For our lab, we would be analyzing this energy relationship with a shaking tube. Our shaking tube had a magnetic inside, along with a coil of wires. By seeing if more shakes would equate to a greater amount of voltage, we would confirm the findings of Faraday’s Law.

The Experiment

To permit the recordings of our data, we utilized LabView and an Excel spreadsheet to record the amount of shakes and the amount of voltage for each trial set. In total, we conducted nine different trials. For each set of three, we did a different number of shakes (from a fast pace, to a medium pace, and finally a slow pace). Each pace would be examined for 30 second intervals.

By looking at three different speeds of shaking the magnet, we were highlighting Faraday’s Law and exploring the relationship between the number of shakes and the amount of voltage produced. The amount of voltage recordings per shake was numerous, spanning well over 100 recordings. A sampling is shown below of one set of shakes:

Number of Shakes Voltages

71

0.17776

71

0.34455

71

-0.13016

71

0.4087

71

0.06229

71

-0.05318

71

0.07512

71

-0.02752

71

0.12644

71

0.08795

71

-0.01469

71

0.11361

71

-0.04035

71

0.03663

71

0.06229

71

0.04946

71

0.03663

71

0.04946

71

-0.01469

71

-0.06601

71

-0.00186

71

-0.04035

71

-0.05318

71

-0.00186

71

0.03663

71

-0.05318

71

0.11361

However, we were able to make our analysis more manageable through our calculations. First and foremost, we utilized the sum of squares formula (simply squaring the voltage recording and then adding them up) to take out any negative recordings. The negative voltages would distort the relationship shown between those shakes and the energy produced. Furthermore, for each number of shakes set, we summed up these squared data entries. By summing up the data, we were able to look at the total amount of energy produced in each 30 second span. Shown below is our calculations of the squared voltages from the 71 shakes data sampling provided prior:

Voltages Squared Voltage

0.17776

0.031598618

0.34455

0.118714703

-0.13016

0.016941626

0.4087

0.16703569

0.06229

0.003880044

-0.05318

0.002828112

0.07512

0.005643014

-0.02752

0.00075735

0.12644

0.015987074

0.08795

0.007735203

-0.01469

0.000215796

0.11361

0.012907232

-0.04035

0.001628123

0.03663

0.001341757

0.06229

0.003880044

0.04946

0.002446292

0.03663

0.001341757

0.04946

0.002446292

-0.01469

0.000215796

-0.06601

0.00435732

-0.00186

3.4596E-06

-0.04035

0.001628123

-0.05318

0.002828112

-0.00186

3.4596E-06

0.03663

0.001341757

-0.05318

0.002828112

0.11361

0.012907232

Lastly, we summed up the squared data from that sampling to come up with the total power produced with 71 shakes:

Number of Shakes Sum of Squared Voltages

71

.425070219


Full Set of Calculations in Table Form

The data for each number of shakes is shown in a table below.

Number of Shakes Sum of Squares (Power/Voltage)

71

0.42507

73

2.137622

71

2.532251

99

8.553348

110

10.1686

113

13.04881

50

1.844339

48

0.465344

What this table shows is the result of squaring each data entry of the 30 second intervals, and summing them up using an excel spreadsheet (as shown in the previous tables). A slight trend can be shown between the number of shakes and the amount of voltage. As a team, Rebecca and I recognized that our squared voltage sums were lower than the recordings of some other groups. However, we were still able to see the relationship in a graph.

What did our calculations show?

Following the summing of the squares of each pace of shaking, we put our data into a graph form. To show the relationship that Faraday’s Law was discussing, we plot a graph on Excel that had power on the y-axis and the number of shakes on the x-axis. To confirm Faraday’s Law, we expected to see a positive relationship. As stated in the law, the greater the magnetic flux, the greater the amount of power/voltage that is produced.

A graph of our data recordings is shown below:

power vs shakes

The graph underscores the positive relationship between the number of shakes and the voltage produced. As we increased the number of shakes, the amount of energy increased.

Conclusion

This lab was a cool way to enhance our learning on energy generation, specifically highlighting Faraday’s Law. By conducting a series of different shake paces, we successfully confirmed the law’s findings. It was a little more stressful than usual because of some technical issues Rebecca and I had, but it all worked out in our favor!

energy generation rebacca

Skip to toolbar