Solar Energy

Solar-Energy

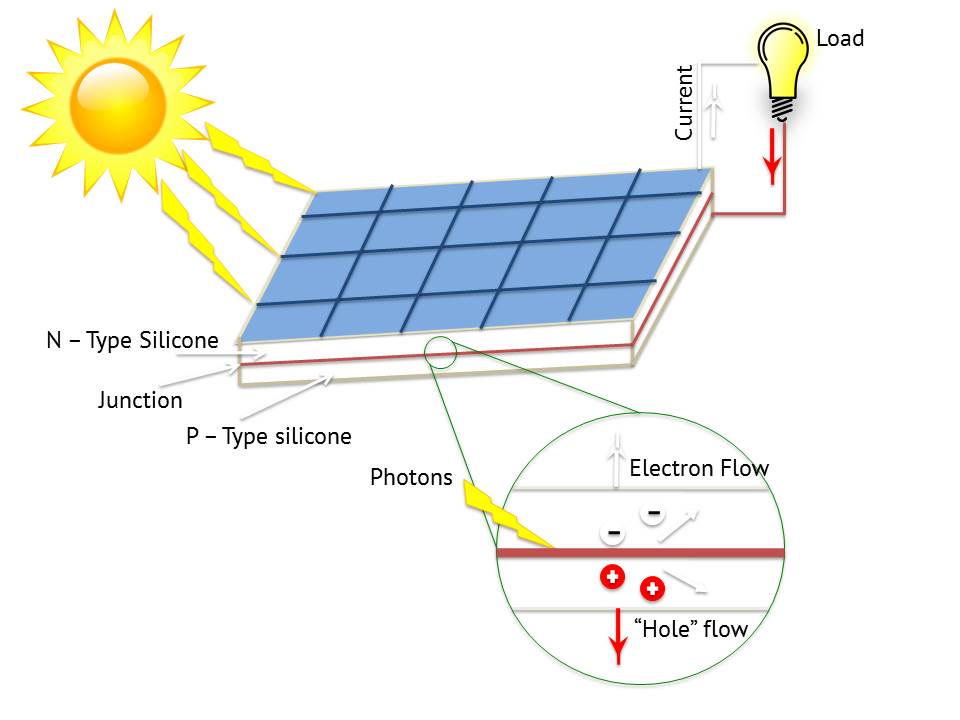
Generating energy is important especially in today’s life.  We need energy to start up any machine or to charge up any device.  Solar energy is one of the many ways to generate electricity but it also depends on many aspects.  Solar energy is the light and heat that comes from the sun and then been harnessed using some technology such as solar photovoltaics, or solar thermal electricity.  A lot of people are familiar with photovoltaic cells or solar panels, they are mostly located on rooftops, spacecraft, or even on calculators.  They are made of semiconductor materials, so when the sunbeam hits the cells, it automatically generate electricity by knocking electrons loose from their atoms while flowing through the cell.  Some countries use sun’s energy as a heat source, where they can use it to boil water or even drive a steam turbine.  There are a lot of examples and methods on how to use this kind of energy, such as placing windows on the sunny side of a building allowing the sun to heat materials located on building floors and walls, and then releases the heat at the night time to keep the building warm.

solor-panel-diagram1

Solar energy is a limitless fuel source, as well as it help to prevent pollution. For example, it generates energy for places that located far from earth like satellites or cabins that is deep in mountains.  Solar energy needs sunlight to work that is why they created storage devices to conserve the energy obtained in case of clouds and at night times.  It also requires a lot of land area and it is not cheap to buy.  On the other hand, solar energy is gaining efficiency it has surged about 20% a year in the past 15 years.  United States, Japan, and Germany are the major markets for solar cells.  The top countries that uses solar energy in fact are Germany, China, and Italy.


1- Germany

Germany have installed 3.8 GW of PV solar capacity, it also added 3.3 GW of solar capacity per year.  Germany have clearly became the world leader of using such source of energy. “The combination of a proven feed-in-tariff (FiT) scheme, good financing opportunities, a large availability of skilled PV companies, and a good public awareness of the PV technology, largely contributed to this success,” European Photovoltaic Industry Association (EPIA) reported.  Germany is expected to stay in the top solar market for the upcoming years.

2- China

The world’s biggest carbon polluter could possibly become the world’s top green energy user.  China is trying to cutdown its coal use, they have been working on developing their solar capacity by an astounding 6,000%.  China is one of the major solar panel manufacturer who started producing solar power from less than one-third of GW to 18.3 GW.  They are working on raising it to 70 GW of solar by 2017.

3- Italy

Italy have raised from fifth place to third place in only three years. Italy generates energy from solar more than any other country.  7.8% of its energy comes from solar comparing to Germany which generates 6.2%. “The future growth of the market will depend on the streamlining and harmonisation of administrative procedures, combined with an adapted decrease of the FIT in the third Conto Energia to cope with the expected price decrease,” the EPIA reports.


New innovative and solar projects:


1- Bringing light to developing countries

SolarLight

While a lot of people have electricity in their homes and the only thing blocking them from receiving lights is a switch, there are 1.2 billion people who live nowadays without access to electricity.  Some of those people use kerosene lamps to see at night times not concerning about their health and what it could poses as well as the accidents that it could cause.  Thankfully there are multiple companies who developed small durable, solar charging lamps which can cheaply replace kerosene lamps such as D.Light, Greenlight planet and Angaza Design.


2- Solar power mobile gadgets:

While our phones and tablets are slightly small and they do not require a lot of energy, solar mobile gadgets still in its novelty phase. There are around 1 billion smartphones in use around the world.  There are few innovations that is going to rock the market like the SolarKindle, where it is integrated with a thin solar panel.  SolarKindle can run for days after receiving only one hour of sunlight.  Another innovation is the Rukus Solar by eton which is basically a portable speaker that runs on solar power, it makes you stream your favorite music via bluetooth.  It can play music for up to 8 hours after being exposed for 6 hours to sunlight.


3- Solar powered transportation:

blue-car-ed01

Commercial solar flights is far from hopping but it is still possible and it will eventually come.  On the other hand, solar vehicles are around the block,scientists and engineers have came close enough to innovate such a thing. Electric cars companies have made a huge progress and they are developing very quickly. However many electric cars have reached cost parity with traditional vehicles over their lifetime, Nissan Leaf is 10% cheaper than an average car.  The fastest growing electric car company is Tesla Motors which I have previously posted a blog illustrates more about it.


References:

http://environment.nationalgeographic.com/environment/global-warming/solar-power-profile/

http://pureenergies.com/us/blog/top-10-countries-using-solar-power/

https://joinmosaic.com/blog/7-new-solar-innovations-could-change-world/

Posted in Uncategorized | 1 Comment

Electric Vehicles


Cars that fully runs on electricity! No sound of an engine, no need to stop by a gas station.  It is happening, electric vehicles are the new revolution, Obama’s goal is to have one million electric cars on the road by 2015. The main goal of producing gas-free cars is to rely less on gasoline.  GM has started it back in 2010 by producing Chevy volt.  However, it takes a lot of effort and engineering processes to start up a new electric car company, such as Tesla Motors.  Although some electric cars companies have gone bankrupt such as Green Cars in England.  Electric cars basically work by powering the electric motor which is provided by a rechargeable battery pack, an onboard gasoline-engine generator, or hydrogen fuel cell.

Electric cars are special and there are many reasons for continuing the interest in these vehicles:

–  They definitely create less pollution than gasoline-powered cars.

–  It does not require a lot of maintenance.

–  They run on electric motor rather than gasoline engine, so no oil change.

–  It helps the country’s economy to grow.

You can never tell from the exterior design that the car is electric, the only difference is that its silent.  But if you look under the hood you will see a lot of differences between gasoline and electric cars:

  • The gasoline engine is replaced by an electric motor.
  • The electric motor gets its power from a controller.
  • The controller gets its power from an array of rechargeable batteries.


Fisker-Tesla2


Fisker & Tesla

Two start ups founded to make cars run on batteries.  But for some reasons Tesla Motors are selling their cars faster the it was expected.  However Fisker Automotive has became very close to bankruptcy.  There are many factors differe the two companies, Tesla has also came close to failing and been forced to scramble for funds.  Tesla Motors has developed its own core technology, the batteries, the electric motor, and the systems for controlling them.  On the other hand Fisker focused more on the look of the automobile, relying instead on technology developed by its suppliers.

“Fisker tried to be innovative with the design. Fisker seemed to think if you designed a beautiful car, people would buy it,” says Brett Smith, codirector for manufacturing, engineering, and technology at the Center for Automotive Research. “The Tesla vehicles are good looking, but Tesla focused more on the technology, not the sheet metal.”

Tesla’s development out passed Fisker in cost and performance.  One example is Tesla’s battery technology.  “Tesla’s lithium-ion battery pack technology is five to 10 years ahead of competitors when it comes to a passenger electric vehicle application, as measured by performance and cost to manufacture,” says Andrea James, an analyst for Dougherty. “Tesla’s battery lead allows it to produce a better vehicle at more affordable price.”


fisker-tesla


Tesla

T

When you save money to buy an expensive car you expect certain things: high acceleration that pushes you back into the seat, high quality sound stereo equipped, and a powerful engine.  Thankfully all those features are installed in the new Tesla Roadster.  Tesla is virtually silent and there is not a single drop of fuel burned.  Tesla also the first high-performance electric car.  Unlike gasoline cars the Tesla is powered by just four main systems:

  • Energy Storage System (ESS)
  • Power Electronics Module (PEM)
  • Electric motor
  • Sequential manual transmission

The Energy Storage System is placed in the rear of the vehicle.

In the Energy storage system, the Tesla Roadster has rechargeable lithium-ion batteries.  They weigh about 1,000 pounds in total, Tesla also claim that they provide “four to five times the energy-density stores of other batteries”.  The batteries are divided into 11 sectors and in each sector there are 621 batteries.  A dependent computer processor controls every battery sector to make sure the charging goes smoothly.  The power Electronics Module (PEM) is an inverter and charging system that handles the conversion from  DC to AC power using around 72 bipolar transistors.  This process helped to increase the power unlike previous generation electric cars.  The batteries provides around 200 kW which can light up to 2,000 light bulbs.  Power Electronics Module also control the voltage levels, motor’s RPM, and the regenerative braking system.

The Roadster’s charging port

There are multiple ways to recharge the Roadster.  First way is to have someone install a recharging station at your house, which is a 220-volt with 70 amp outlet that makes the recharged within 3.5 hours.  There’s also a portable kit that allows you to charge the car using any outlet, and the length of time depends on the voltage of that outlet.

There are many sensors installed in order to detect temperature, acceleration, deceleration, tilt and smoke.  If the sensor detects an a crash it shuts down everything automatically.


References:

http://www.departures.com/articles/tesla-roadster-versus-fisker-karma

http://www.motortrend.com/features/consumer/1306_fisker_vs_tesla/?__federated=1

http://www.technologyreview.com/news/513151/why-tesla-survived-and-fisker-wont/


Posted in Uncategorized | Leave a comment

Electricity Generation

Some people think that all it takes to generate power is flipping a switch! No it is not that simple.  Mother nature provided us with different sources that we can use to generate electricity, some of those sources are limitless such as wind or solar power.  On the other hand our generation mostly depend on thermal power plants such as coal, natural gas, and nuclear plants to generate power.  For every energy source a chemical or mechanical process is required to turn it into usable electricity.  Researchers work everyday to find innovative ways to generate power, and convert natural sources into usable energy through different methods.

U.S._2013_Electricity_Generation_By_Type_crop

Coal and Natural Gas:

Fuels like Coals, natural gas are used to heat water until it produces steam.  Steam used in the process to power the turbine which generates electricity.  Steam turns the blades around a router inside of a turbine which is connected to a main shaft which spins magnets with coals inside of generators.  The generator inside of the turbine converts mechanical energy into electrical energy.  Steam is an efficient method of producing energy since the water used in the process can be recycled and reused.  Old coal power plants, are significantly less efficient and produces higher levels of waste heat.  Studies show that 40% of the world’s electricity comes from coal.  Natural gas is much more cleaner choice for thermal power generation.  Natural gas can lower CO2 emissions by up to 60 percent.  The US have more natural gas reserved than any other country.   A natural gas facility is less expensive to build that as of a coal facility, and at least a fourth as expensive as nuclear power plant.


Nuclear Plants:

There is not a lot of big differences between generating electricity using nuclear power plants and fossil-fuel plants.  The only difference is that in nuclear power plants they use the steam that’s been heated through atomic fission rather than burning coal, or gas.  Nuclear plants don’t use a lot of fuel which is a great advantage, unlike coal which needs to be refueled regularly.  However waste water is much more hotter than that of fossil plants, that is why large cooling towers are attached to solve this problem.  There are many reasons that made nuclear power plants are less attractive, such as disposing the contaminated accessories from the fuel cores.  As well as the accidents that could lead to a disaster like what happened at the Three Mile Island back in 1979.


https://www.youtube.com/watch?v=_UwexvaCMWA


References:

http://americanhistory.si.edu/powering/generate/gnmain.htm

http://www.ntpc.co.in/index.php?option=com_content&view=article&id=56&Itemid=66&lang=en

http://www.powerscorecard.org/tech_detail.cfm?resource_id=6

Posted in Uncategorized | 2 Comments

Hydraulic Fracturing

Hydraulic fracturing, or fracking, is one of the most important methods to extract natural gas to the surface.  For nearly 60 years fracking played a big role for America’s development.  35,000 wells in the US are using hydraulic fracturing method.  The first hydraulically fractured well was built in the 1940s.  Studies show that most of natural gas wells in the future will require hydraulic fracturing.


How does it work?

How Fracking Works

Water and sand are the main components of hydraulic fracturing.  High pressure is used during the injection of water and sand into the formation to create cracks, allowing resources to move freely inside the pores.  Mostly, a pipe made of steel is cemented into place at the top of the well to protect groundwater from flowing upward.  The depth of wells usually depends on groundwater protection as well as other factors such as the geological history of surface land.  When drilling deeper into the well additional casing is added for protection of formations, from which oil or natural gas is to be produced.  It also protect groundwater from the chemicals that been used.  Casing an cementing play an important role during the well construction process, they do not only protect groundwater but also essential to extract oil and natural gas successfully.  Nearly 99% of the fluids used consist of water and sand, however some chemicals added to strengthen the flow, and those chemicals vary from well to another.

Fracking Wells in Western Wyoming

Benefits:

  • The replacement of coal in power stations.
  • Shale gas is cheaper than coal.
  • Cleaner, greener and cheaper.
  • Better and easier method to find oil
  • Increases country’s energy security.


Risks:

  • Contamination of groundwater.
  • Methane pollution might lead to climate change.
  • Air pollution
  • Toxic chemicals exposure.
  • Possibility of gas explosions.


Fracking wells have been developed across the country, with highest density in Texas, Wyoming, California and Pennsylvania. (Source: US Environmental Protection Agency, 2012)

Environmental impact:

Contamination of water and air pollution are the major impacts on environment.  A number of instances with groundwater contamination have been documented, however in most cases a direct link between hydraulic fracturing and groundwater contamination could not be established. Researchers at the US (EPA) have shown that fracking have contaminated groundwater in 1987.  In 2007 Valerie Brown said “public exposure to the many chemicals involved in energy development is expected to increase over the next few years, with uncertain consequences”.


References:

http://www.energyfromshale.org/hydraulic-fracturing/what-is-fracking

http://www.elsevier.com/connect/fracking-the-pros-and-cons

http://serc.carleton.edu/NAGTWorkshops/health/case_studies/hydrofracking_w.html

Posted in Uncategorized | Leave a comment

Energy Grid

The outage brought darkness to NYC, the city that never sleeps.  That happened in 2003 when the demand out passes the supply.  The way we receive energy haven’t changed very much for the past hundred years.  Coal, nuclear, or hydropower plants send electricity through transmission lines to substations on to transformers.  The voltage becomes smaller and smaller until it reaches our homes.  “For all automated manufacturing processes, if the computer resets, it shuts down the process. If you’re a plastics manufacturer, and your machines cool down, plastic solidifies in your machines,” says Boyes.  If a lighting strikes a power line it’ll knock it off, or if a day’s events exceed utilities’ effort you experience a blackout, like what happened in the Northeast back in 2003.

Most of electric-power around the world have similar outdated infrastructure.  “The Grid” basically referred to the combination of power generation, transmission, conversion and distribution.  Governments around the world are working on modernize this outdated infrastructure making them more intelligently efficient.

“Smart Grids” are the 21st century’s innovation, where suppliers can monitor and communicate more accurately with demanders making energy flows more securely preventing any blackouts and shutdowns.  What makes them smart is the ability to measure, process, and communicate in order to sustain and balance power flows.


Pros:

  • It can detect faults and repair them.
  • It help producers to better balance supply and demand.
  • Reduces the chance of having a blackout.
  • Eliminating manual meter reading.

Cons:

  • Processes of the transition to a new technology.
  • People’s reaction of accepting the new meters.
  • More expensive to assemble.

On the other hand pros are outweighing cons, “According to the International Energy Administration, the deployment of a smart grid can result in a 0.9 to 2.2 gigatonne reduction in CO2 emissions by 2050.”


References:

http://science.howstuffworks.com/environmental/green-tech/sustainable/grid-energy-storage1.htm

https://www.smartgrid.gov/all/news/2_minute_expert_briefing_smart_grid_technology

http://www.ti.com/lsds/ti/apps/smartgrid/gridinfrastructure/overview.page

Posted in Uncategorized | Leave a comment

Robot’s Activity

Lab 1 :


First day of lab our task was to put logos together to assemble a robot.  It a was a bit tricky to do so since there were a lot of tiny little parts that looked the same to me.  However, after assembling the robot we had the chance to actually run it by inserting the battery in the bottom of the device.  Then we plugged it to the PC and we ran the Labview program to test it.  Then on the second day we had to measure the circumference of the robot and it was 0.18 meters.

Circumference = π(diameter)

Then we were asked to measure the distance using the ruler and compare it with the Labview program in different trials by changing power and time 3 times. (9 total).  As well as number of turns, velocity, and error percentage.  in order to get percentage error we had to use this equation:

%Error= ((DistanceRuler- DistanceLabview)/((DistanceRuler+DistanceLabview)/2))*100

And the results were as shown:


Set#1

Time: 2 Seconds            Power: 38

Trials#                             Trial 1              Trial2           Trial3

Distance(ruler)                 0.28               0.278            0.281

Distance(Labview)          0.283              0.2775          0.2815

# of turns                          1.5722             1.5416           1.5638

Velocity                             0.1415              0.1387          0.1470

% Error                             -1.06                  0.18             -0.17


Set#2

Time: 1.5 Seconds            Power: 42

Trials#                               Trial 1              Trial2           Trial3

Distance(ruler)                 0.236              0.233            0.234

Distance(Labview)          0.233              0.233            0.2342

# of turns                          1.297               1.2944           1.2916

Velocity                             0.156               0.1553            0.155

% Error                             1.279                     0               -0.10


Set#3

Time: 1.2 Seconds            Power: 60

Trials#                             Trial 1              Trial2           Trial3

Distance(ruler)                 0.274              0.273           0.273

Distance(Labview)          0.275              0.272            0.273

# of turns                          1.528             1.513               1.516

Velocity                             0.229              0.227            0.2275

% Error                             -0.364             -0.18                0


Lab 2:


image003

The second lab was a bit tricky and challenging.  Our task was to use the Lego Mindstorm motor to lift weights with a pulley.  In the beginning my partner and I had to measure the weight in order to get the mass.  Total mass attached to the pulley was 200 grams.  Then we connected the motor to the computer and ran the assigned VI file on Labview in order to start the measurements.  However it was very helpful that we did not need to write down any of the results after running the motor, our professor showed us a way where we can find all the results stored on Excel after doing all the trials.  Labview automatically store all results and sends it to Excel.  Our job was to find out how fast does the motor pulls the weight and how much time does it take.  We manually change the the power in order to compare results.  We had to do four trials with the same power, we decided to make it 60.  And 4 other trials with different mass, we chose 160 grams.  We explored Newton’s second law F = m * a.  As well as finding potential energy PE=m*g*h.  After we got all the measurements we were able to find the power used by this formula:

Power used=PE/time

On the next part we were asked to plot different diagrams to clearly show and support our results and measurements.


Results were as shown:

Speed(rpm) Battery Discharge Mass Power Time Acceleration Potential Energy Power used
74.391172 83 0.12 60 1.752 42.460715 0.4116 0.2349
72.403616 55 0.14 60 1.807 40.068409 0.4802 0.2657
71.312935 55 0.18 60 2.059 34.634743 0.6174 0.2998
72.94811 41 0.2 60 2.319 31.45671 0.686 0.2958
91.730442 83 0.16 75 1.568 58.501558 0.5488 0.35
93.557727 56 0.16 80 0.921 101.582766 0.5488 0.5958
104.619226 97 0.16 85 1.335 78.366461 0.5488 0.411
112.163146 42 0.16 90 1.373 81.692022 0.5488 0.3997

Screen Shot 2014-09-25 at 6.51.47 PMScreen Shot 2014-09-25 at 6.51.33 PM

Screen Shot 2014-09-25 at 6.51.57 PM


Lab 3:


In this lab our task was to generate power through the shaking of a flashlight with a magnet that moves back and forth inside a coil of wire.  Then we were asked to collect date through Labview program.  Main goal was to understand Faraday’s Law which states that changing magnetic fluxes through coiled wires generate electricity, so the more we shake the flashlight the more electricity we generate.  We correlated the number of shakes of the generator in a thirty second interval, with the voltages.  Then we calculated the sum of the squares of the voltages.  We repeated the procedure three more times with different rates of shakes.  Results were as shown:


Trial 1 Trial 2 Trial 3
Voltages Squared Voltages Voltages Squared Voltages Voltages Squared Voltages
0.03663 0.001341757 -5.57008 31.02579121 0.26757 0.071593705
-0.77166 0.595459156 -2.68333 7.200259889 -0.33544 0.112519994
-0.04035 0.001628123 -5.55725 30.88302756 0.01097 0.000120341
-0.00186 3.46E-06 -0.20714 0.04290698 -0.04035 0.001628123
0.0238 0.00056644 -4.2101 17.72494201 0.0238 0.00056644
0.33172 0.110038158 0.0238 0.00056644 0.0238 0.00056644
-1.2592 1.58558464 0.46002 0.2116184 -0.07884 0.006215746
0.52417 0.274754189 -0.06601 0.00435732 -0.06601 0.00435732
0.43436 0.18866861 0.22908 0.052477646 -1.0026 1.00520676
-0.06601 0.00435732 -0.05318 0.002828112 -3.10672 9.651709158
5.51504 30.4156662 -5.55725 30.88302756 -0.20714 0.04290698
-0.01469 0.000215796 6.51578 42.45538901 -0.00186 3.46E-06
-0.33544 0.112519994 5.56636 30.98436365 -0.07884 0.006215746
-0.97694 0.954411764 -3.14521 9.892345944 -0.09167 0.008403389
-0.24563 0.060334097 -5.58291 31.16888407 -0.01469 0.000215796
-0.05318 0.002828112 6.46446 41.78924309 -0.09167 0.008403389
-0.00186 3.46E-06 -0.06601 0.00435732 -0.06601 0.00435732
3.34677 11.20086943 3.4879 12.16544641 -0.07884 0.006215746
-0.86147 0.742130561 -0.09167 0.008403389 5.97692 35.72357269
5.04033 25.40492651 6.37465 40.63616262 -0.09167 0.008403389
-0.15582 0.024279872 0.16493 0.027201905 -0.04035 0.001628123
0.0238 0.00056644 -0.04035 0.001628123 -1.23354 1.521620932
-4.94141 24.41753279 1.08869 1.185245916 6.46446 41.78924309
-0.06601 0.00435732 0.08795 0.007735203 -0.07884 0.006215746
-1.91353 3.661597061 -5.57008 31.02579121 -0.06601 0.00435732
0.9219 0.84989961 0.47285 0.223587123 -0.07884 0.006215746
4.74524 22.51730266 -0.41242 0.170090256 -0.06601 0.00435732
-1.97768 3.911218182 0.01097 0.000120341 -1.28486 1.65086522
-5.55725 30.88302756 0.01097 0.000120341 3.62903 13.16985874
Sum of Squared Voltages Sum of Squared Voltages Sum of Squared Voltages
189.5849093 359.777919 104.8175442
# of Shakes # of Shakes # of Shakes
60 63 71


Screen Shot 2014-10-03 at 1.48.38 AM

Lab 4:

This lab was pretty interesting because I always wanted to experience how solar panels work and how do they generate electricity.  In this lab me and my partner had the chance to actually try to generate electric power through the panels we were given.  At the beginning we had to open the Labview program in order to take measurement and record them and then have them organized in Excel.  We had a flash light and a solar panel as well as different colors to put on the top of the panel to observe the effect of colors on solar panels.  We also had to do different trial with different distances.  The results we as shown below:

Trial 1 Trial 2 Trial 3 Trial 4 Trial 5 Trial 6
0.58832 0.537 0.58832 0.48568 0.54983 0.49851
0.49851 0.47285 0.48568 0.537 0.56266 0.48568
0.54983 0.54983 0.52417 0.48568 0.537 0.48568
0.58832 0.52417 0.537 0.47285 0.47285 0.57549
0.58832 0.48568 0.48568 0.49851 0.46002 0.51134
0.58832 0.48568 0.54983 0.46002 0.47285 0.54983
0.48568 0.49851 0.47285 0.46002 0.47285 0.48568
0.58832 0.56266 0.51134 0.47285 0.56266 0.46002
0.54983 0.54983 0.57549 0.46002 0.46002 0.46002
0.51134 0.58832 0.56266 0.47285 0.52417 0.537


Red Orange Blue Black
0.57549 0.47285 0.48568 0.47285
0.57549 0.48568 0.54983 0.52417
0.46002 0.47285 0.47285 0.46002
0.49851 0.47285 0.47285 0.46002
0.46002 0.56266 0.47285 0.47285
0.56266 0.537 0.537 0.46002
0.49851 0.47285 0.47285 0.46002
0.48568 0.56266 0.47285 0.51134
0.47285 0.54983 0.56266 0.46002
0.54983 0.537 0.54983 0.46002


Colors Averages
Red 0.513906
Orange 0.512623
Blue 0.504925
Black 0.474133

Screen Shot 2014-10-26 at 5.49.09 PMScreen Shot 2014-10-26 at 5.49.31 PM


Distances Averages
0 0.553679
3 0.525453
7 0.529302
10 0.480548
14 0.507491
17 0.504925
Posted in Uncategorized | Leave a comment